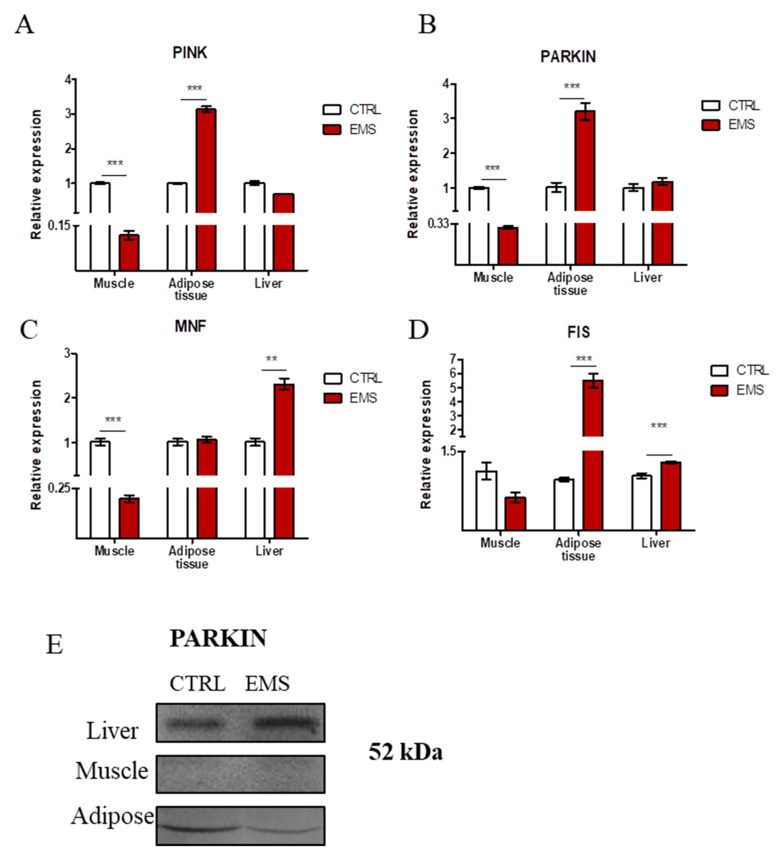
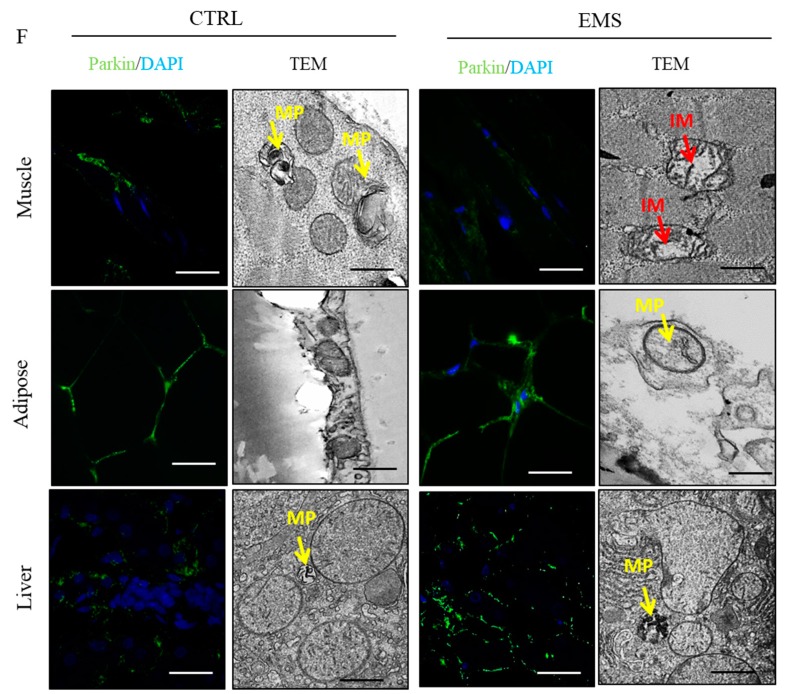
Figure 6.
Evaluation of mitophagy and mitochondrial dynamics in tissues from healthy and EMS-diagnosed horses. Using RT-PCR, the expression of PINK (A), PARKIN (B), MNF (C) and FIS (D) was investigated. PARKIN amount was also examined by Western blot (E) and immunofluorescence staining (F). TEM imaging (F) allowed for visualization of mitophagosomes’ formation (indicated with yellow arrows) and mitochondria morphology impairment (indicated with red arrows). MP, mitophagosomes; IM, impaired mitochondria. Results expressed as the mean ± S.D. ** p < 0.01, *** p < 0.001. Scale bars: confocal 20 µm, TEM 100 nm.


