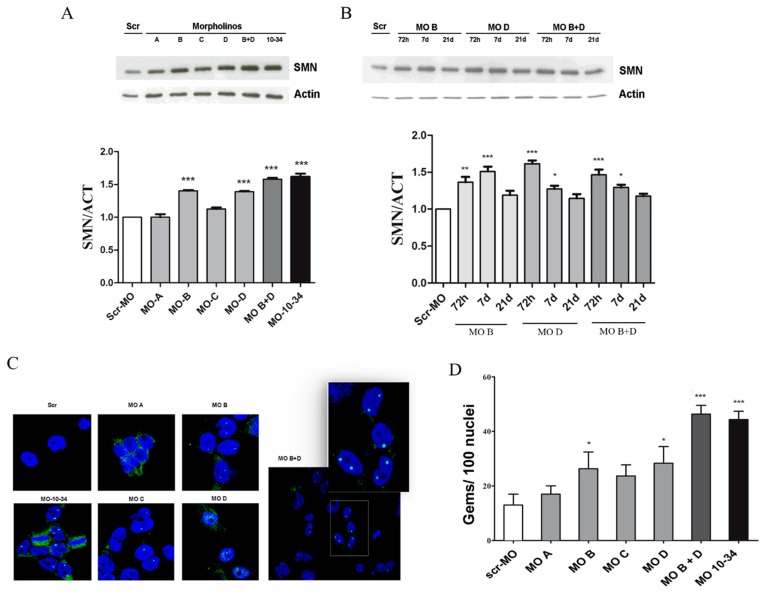
Figure 3.
New MO sequences are able to upregulate the SMN protein in spinal muscular atrophy (SMA) induced pluripotent stem cells (iPSCs). (A) A representative image is shown of western blot analysis and densitometry analysis on iPSCs generated from a SMA type 1 (3 SMN2 copies) patient treated with different MO sequences. The levels of the SMN protein increased significantly after treatment with MO B and MO D. Combined nucleofection with MO B + MO D was more effective and comparable to that of MO-10-34 treatment (*** p < 0.001); (B) A representative image is shown of western blot analysis and densitometry analysis on SMA iPSCs collected at different time points after the nucleofection (72 h; 7 days; 21 days, * p < 0.05, ** p < 0.01, *** p < 0.001); (C) Representative images are shown of treated SMA iPSCs. Nuclear gems (green) were detectable in all MO-treated cells compared to cells treated with scr-MO. In the right panel a magnification of the white frame of MO B + D image. Nuclei are labeled with DAPI (blue); (D) The number of gems are compared in human SMA iPSCs treated with different MO sequences. The greatest increases were observed after co-treatment with MO B + MO D or with MO-10-34 (*** p < 0.001). Two independent observers examined at least 100 nuclei in randomly selected fields from each slide, and recoded the gems number. The values show the means + SD from 3 independent experiments. Scr-MO: scrambled-MO. Scale bar: 75 µm. MO B + D: 85 µm, insert 50 µm.

