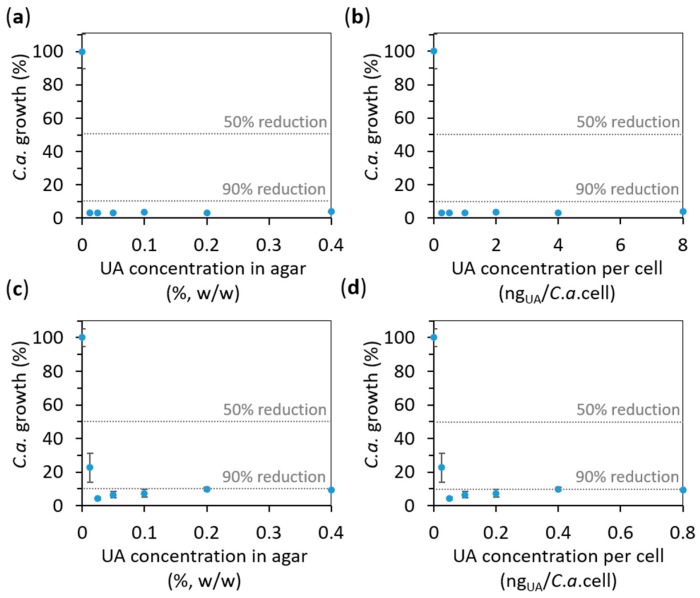
Figure 7.
The effect of undecylenic acid (UA) on the Candida albicans (C.a.) cell growth in the supernatant above the surface of agar containing the given concentrations of UA (evaluated by measuring the absorbance at 620 nm, A620). The results obtained for C.a. cells concentration of (a,b) 106 C.a. cells/mL and (c,d) 107 C.a. cells/mL are expressed as average percentages of A620 readings compared to control (0% UA) versus UA concentration: (a,c) in agar and (b,d) per C.a. cell calculated for the number of incubated C.a. cells (all values are given as mean ± standard deviation). The vertical dashed lines indicate 50% and 90% of the C.a. growth reduction.

