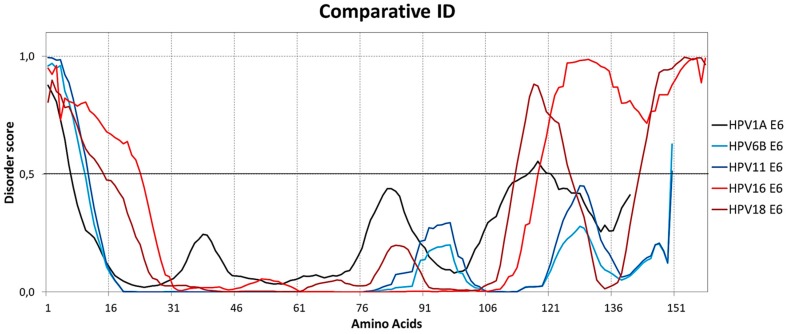
Figure 4.
Comparison of intrinsic disorder between E6 of HPV16 and HPV18 (high-risk), HPV6B and HPV11 (low-risk), and HPV1A (control). High-risk HPV16 and HPV18 E6 proteins have considerably longer regions of intrinsic disorder at both ends, especially at the C-terminus. The dashed lines at 0.5 of y-axis are threshold lines for disordered/structured residues. Residues with a score above this line are predicted disordered, and residues with a score below 0.5 are predicted to be ordered. These results were obtained using the PONDR-FIT tools [21].

