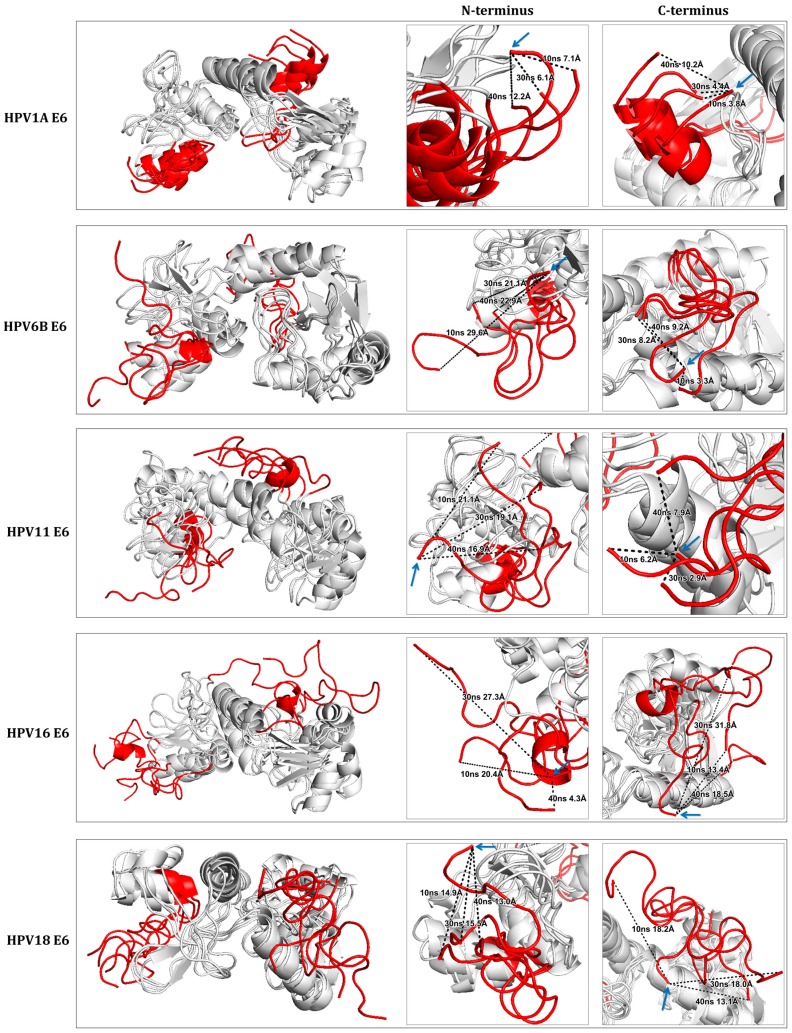
Figure 5.
Comparison between the different structural conformations of E6 proteins from HPV16, HPV18, HPV6B, HPV11, and HPV1A by molecular dynamics simulation. The N- and C-termini of the structures are highlighted in red and the central region between the terminals is shown in gray. The panels, next to the aligned structures, highlight the two termini with the black dotted lines showing the distance of the variation of the same amino acids at times 0 (indicated by the blue arrow), 10, 30, and 40 ns. It is observed that the structural variation occurs mainly in the terminal regions of all the structures. Distances were measured using PyMOL 2.0 software [27]. Dotted line: the distance of the variation of the same amino acids.

