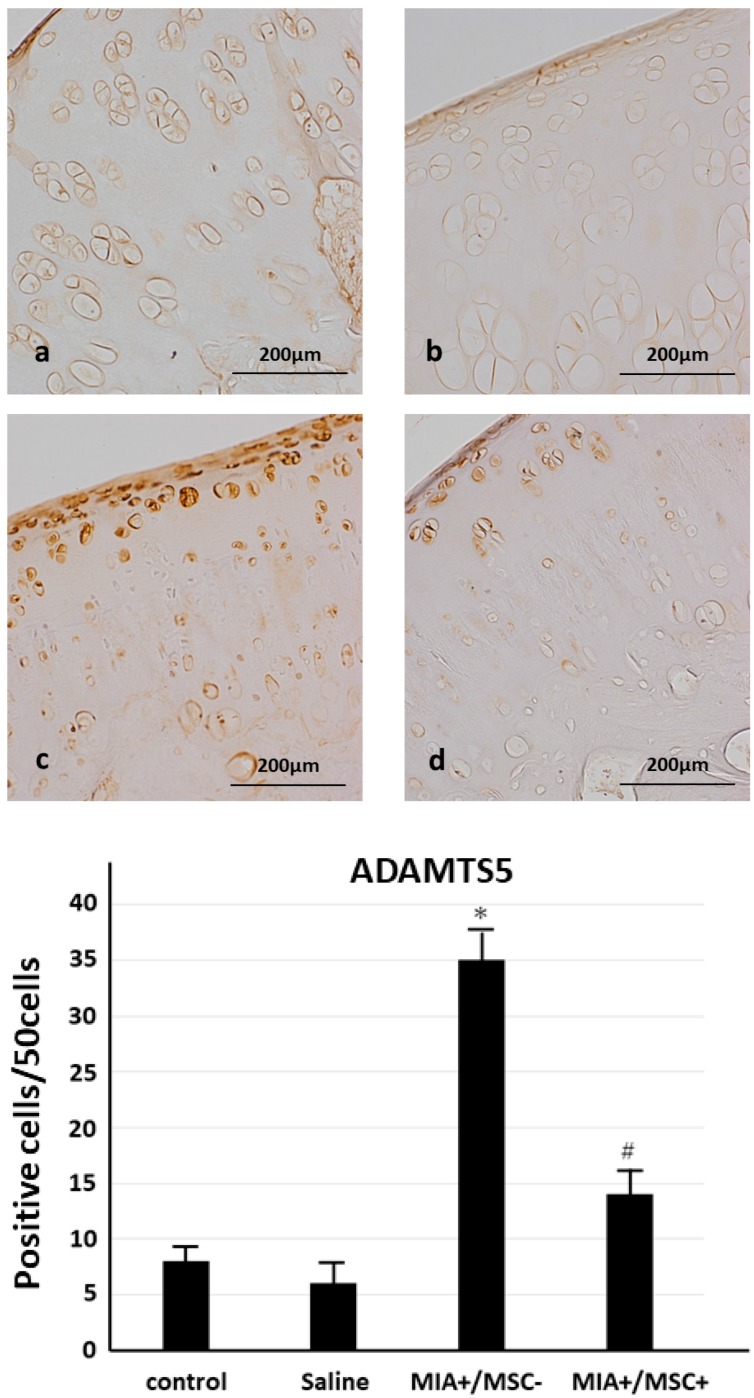
Figure 4.
ADAMTS5 expression in cartilage tissue. (a) control group, (b) Saline group, (c) MIA+/MSC− group, (d) MIA+/MSC+ group. Control group and Saline group: Almost no ADAMTS5 is found in cartilage cells. MIA+/MSC− group: ADAMTS5 is extensively expressed from the hypertrophied cartilage layer to surface layer of cartilage cells. MIA+/MSC+ group: ADAMTS5 expression in cartilage cells is greater than in control and Saline group, but as compared with MIA+/MSC− group, ADAMTS5 expression is diffuse and clearly. A significant increase in ADAMTS5 expression is found in the MIA+/MSC− group. In the MIA+/MSC+ group as compared with A, B, it is increased, while as compared with the MIA+/MSC− group it is significantly decreased. * p < 0.001 compared to the untreated control. # p < 0.001 compared to the (MIA+/MSC−) group.

