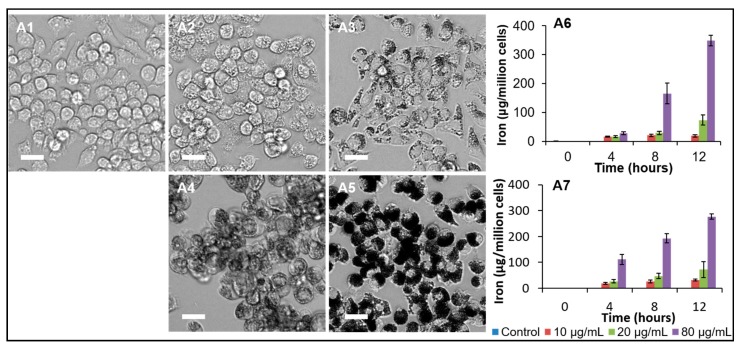
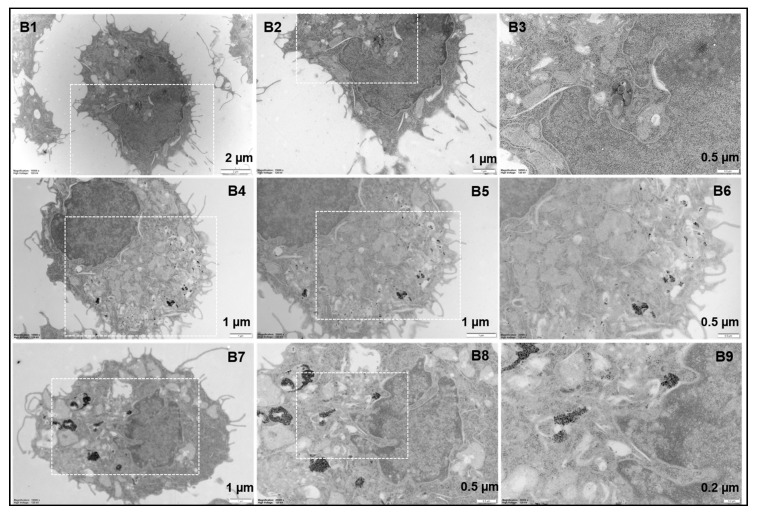
Figure 7.
Characterization of s-SPION uptake in RAW264.7 macrophages. (A1–A5) bright-field microscope images of cells grown in monolayers untreated (A1) and treated with 10 nm (A2,A3) or 25 nm (A4,A5) s-SPIONs for 24 h at 25 µg/mL (A2,A4) and 250 µg/mL (A3,A5). Scale bar: 40 µm. (A6,A7) iron levels in the cells grown in suspension when treated with 10 nm (A6, n = 3/time point) or 25 nm (A7, n = 3/time point) s-SPIONs. (B) TEM images of control macrophages (B1–B3) and macrophages treated with 10 nm (B4–B6) and 25 nm (B7–B9) s-SPIONs at 20 µg/mL for 24 h.


