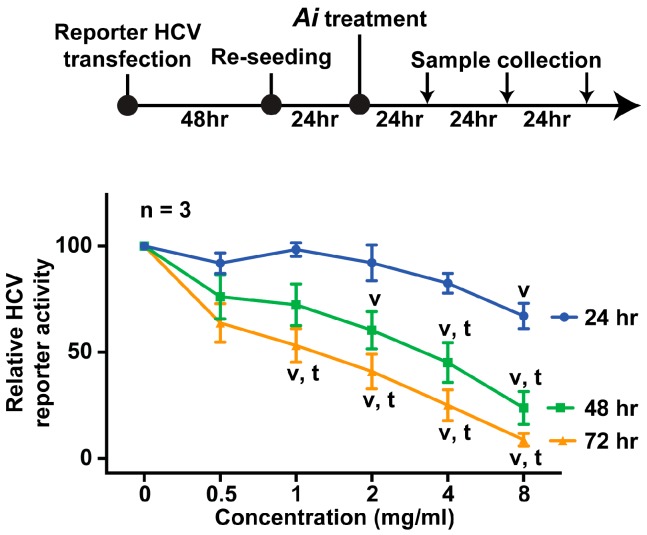
Figure 3.
Effects of the Aeginetia indica decoction on the HCV reporter activity in Huh7.5.1 cells. Values are mean ± SEM summarized from three independent experiments and normalized against those under the vehicle control (0 mg/mL). Blue, green, and yellow lines represent respectively the HCV reporter activity measured at 24, 48, and 72 h after exposure to the idicated doses. Ai, Aeginetia indica decoction; v, p < 0.05 t-test against values under the vehicle control; t, p < 0.05 t-test against values at 24 h.

