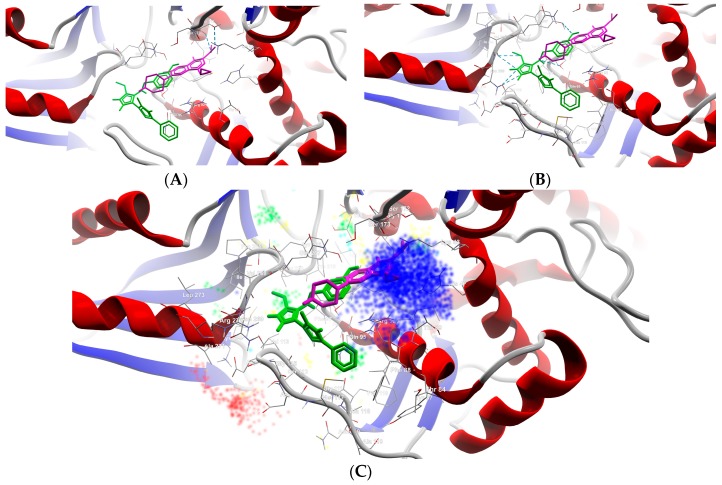
Figure 4.
Details of the best docking poses of CIP (pink-magenta) and B8 (green) against gyrA (target is depicted as thin sticks with a secondary structure drawn as a cartoon backbone, where ligands are figured as sticks and H-bonds are depicted as dashed blue lines). In detail (A), the image is focused on the CIP binding mode, emphasizing the two H-bonds established with Ser172 and Gly171 (in order to simplify the image, only the nearest AAs residues–until a 5.0 Å distance from CIP, are shown); In detail (B), the image is focused on the B8 binding mode, emphasizing the six H-bonds established with Val113 (2 H-bonds), Val268 (2 H-bonds), Ser98, and Tyr266 (to simplify the image are shown only the nearest AAs residues–until a 5.0 Å distance from B8); Detail (C) illustrates the energy grid: green–steric favorable; light blue–hydrogen acceptor favorable; yellow–hydrogen donor favorable; red and dark blue–electrostatic interactions (cropped view showing only the nearest AAs residues–until a 7.5 Å distance from B8).

