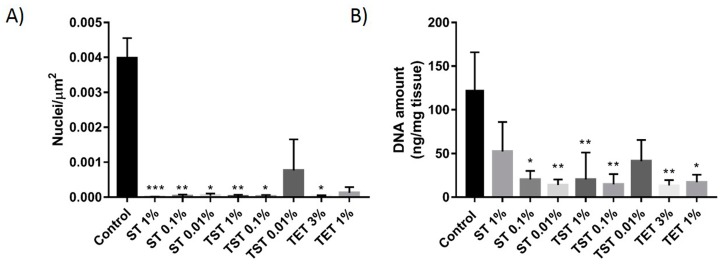
Figure 2.
DNA quantification in DT. (A) Nuclei were counted on H and E-stained slides of native tissue and DT and represented as the number of nuclei per µm2; (B) Following tissue digestion, DNA was extracted and quantified using the Quant-iT™ PicoGreen® dsDNA assay. The results are presented as means ± SD. *** p < 0.001, ** p < 0.01, * p < 0.05.

