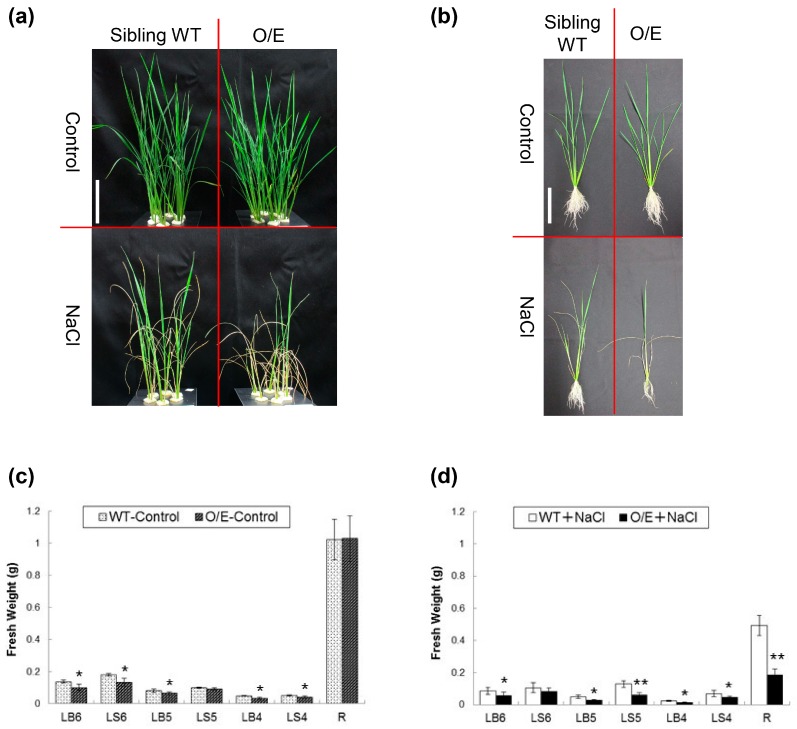
Figure 4.
Increased salt sensitivity of the O/E line. (a) Pictures of O/E and sibling WT plants, which were prepared by hydroponic culture for approximately 2 weeks, and then treated with or without salt stress (a stepwise 25 mM increase in the NaCl concentration from 25 to 75 mM) for 9 days; (b) a representative plant from each condition mentioned in (a). Note that the white bars in (a) and (b) represent 10 cm; (c) fresh weights of leaf tissues and roots of O/E and WT plants, grown without salt stress (n = 6, ±SD); (d) fresh weights of leaf tissues and roots of O/E and WT plants, treated with salt stress (n = 6, ±SD). LB, LS, and R represent, respectively, leaf blades, leaf sheaths, and roots. Larger numbers on LB and LS represent younger leaves. Asterisks indicate significant differences between O/E and WT plants (Student’s t-test; * p < 0.05, ** p < 0.01).

