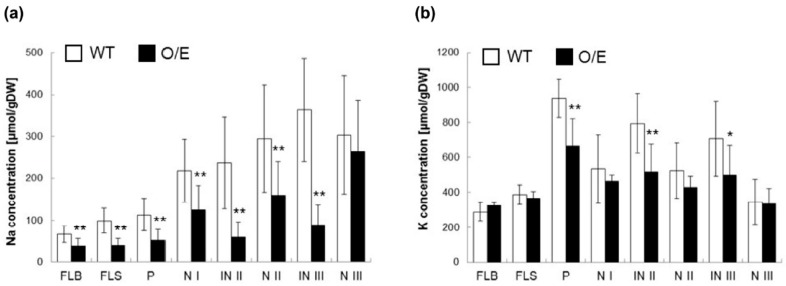
Figure 7.
Measurements of Na and K concentrations using salt-stressed O/E and WT plants, which were in the reproductive growth stage. O/E and WT plants were grown in the same pot filled with the paddy filed soil, and, when the plants started heading, salt stress was imposed by gradually increasing the NaCl concentration in the tap water from 25 to 100 mM for more than a month. (a) Na concentrations in tissues of flag leaves and stems of O/E and WT plants (n = 12, ±SD); (b) K concentrations in the same tissues as in (a) (n = 12, ±SD). FLB, FLS, P, N I, IN II, N II, IN III, and N III represent, respectively, the flag leaf blade, the flag leaf sheath, peduncle, node I, internode II, node II, internode III, and node III. Asterisks indicate significant differences between O/E and WT plants (Student’s t-test; * p < 0.05, ** p < 0.01).

