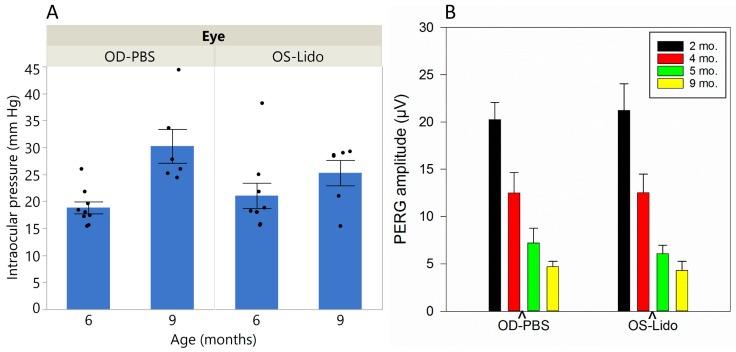
Figure 3.
Intraocular pressure (IOP) and PERG amplitude as function of age in Lidocaine-treated and PBS-treated D2 mice. (A) IOP increases with age with no apparent differences between Lidocaine-treated and PBS-treated D2 mice. Bars represent the mean ± SEM (6 mo., N = 9; 9 mo., N = 6); black dots represent measurements in individual mice; (B) PERG amplitude declines with increasing age, with no apparent differences between Lidocaine-treated and PBS-treated D2 mice. Bars represent the mean ± SEM (2 mo., N = 7; 4 mo., N = 20; 5 mo., N = 9; 9 mo., N = 17).

