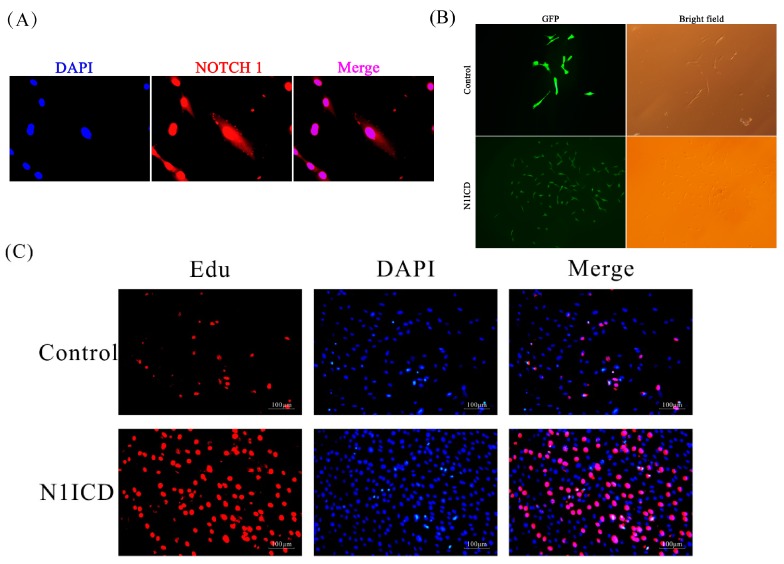
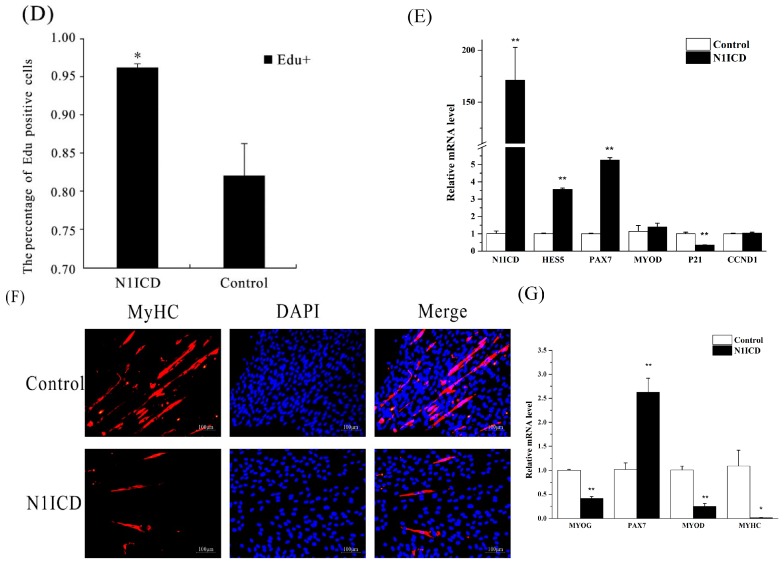
Figure 1.
The model of N1ICD overexpressed PSCs. (A) The expression of N1ICD was tested by immunocytochemistry. DAPI, blue, represents nuclei; NOTCH1, red; Merge, pink, represents N1ICD expressed in nuclei of PSCs. (B) One week later, the degree of green fluorescence protein (GFP) in the control group is greener than the N1ICD-overexpressed group. However, the level of N1ICD expression in the N1ICD-overexpressed group is more than the control group. (C,D) Representative images of the immunofluorescent staining for proliferating PSCs are shown. Proliferating PSCs were labeled with Edu fluorescent dye (red). (E) Q-RT-PCR showed the changes of N1ICD, hes family bHLH transcription factor 5 (HES5), paired box 7 (PAX7), myogenic differentiation 1 (MYOD), cyclin dependent kinase inhibitor 1A (P21) and cyclin D1 (CCND1) in proliferating PSCs. Overexpressed N1ICD in PSCs did not show any changes in mRNA level of MYOD and CCND1. * p < 0.05; ** p < 0.01. Data are the mean ± S.E.M, n = 3 for each treatment. (F) Representative images of the immunofluorescent staining for differentiating PSCs are shown. Myosin heavy chain (MYHC) was labeled by fluorescent dye (red). Scale bar = 20 μm (×200 magnification). (G) Q-RT-PCR showed the changes of myogenin (MYOG), PAX7, MYOD and MYHC in overexpressed N1ICD differentiating PSCs. MYOG and MYOD significantly decreased while PAX7 significantly increased in overexpressed N1ICD differentiating PSCs. * p < 0.05; ** p < 0.01. Data are the mean ± S.E.M, n = 3 for each treatment.


