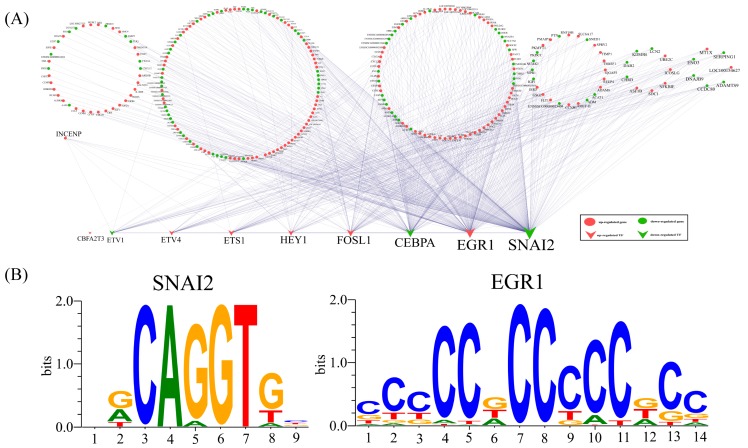
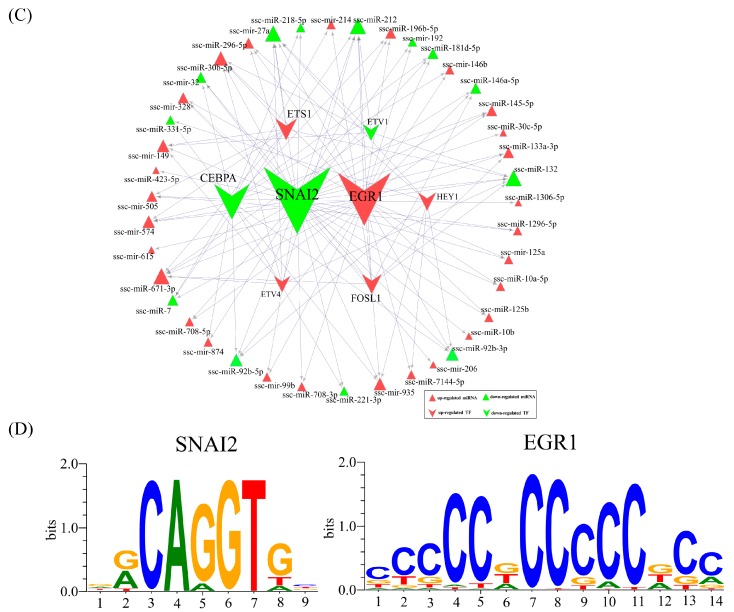
Figure 4.
Analyses of TF-mRNA and TF-miRNA networks in P-N1ICD vs. P-Control. (A) The network of TF-mRNA in P-N1ICD vs. P-Control; red circular represents upregulated DEGs; green circular represents downregulated DEMs; red V-shape represents upregulated TFs; and green V-shape represents downregulated TFs. (B) The sequence logo display for transcription factors of SNAI2 and EGR1 whose binding sites are significantly enriched in the regulation of DEGs in P-N1ICD vs. P-Control. (C) The network of TF-miRNA in P-N1ICD vs. P-Control; red triangle represents upregulated DEMs; green triangle represents downregulated DEMs; red V-shape represents upregulated TFs; and green V-shape represents downregulated TFs. (D) The sequence logo display for transcription factors of snail family transcriptional repressor 2 (SNAI2) and early growth response 1 (EGR1) whose binding sites are significantly enriched in the regulation of DEMs in P-N1ICD vs. P-Control.


