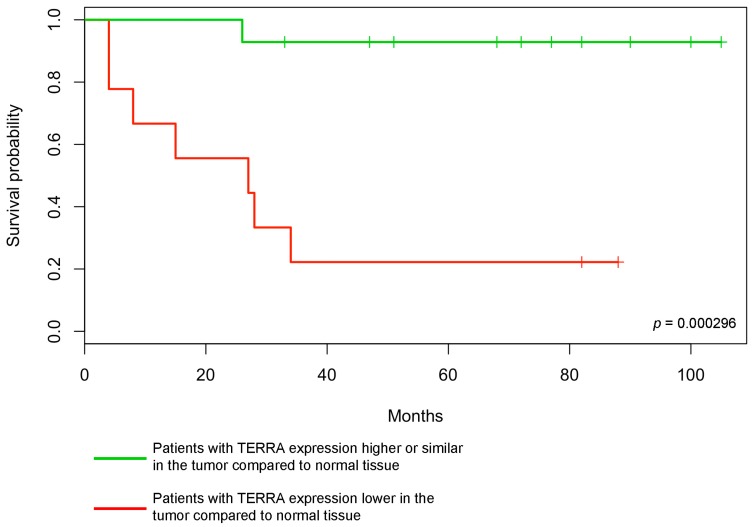
Figure 3.
Disease free survival of 23 HNSCC patients. The probability of disease free survival, in months, in the two classes of patients is shown. Patients with TERRA expression higher or similar in the tumor compared to normal tissue (green curve), patients with TERRA expression lower in the tumor compared to normal tissue (red curve). The p-value of the log-rank test for the statistical significance of the difference between the two curves is shown.

