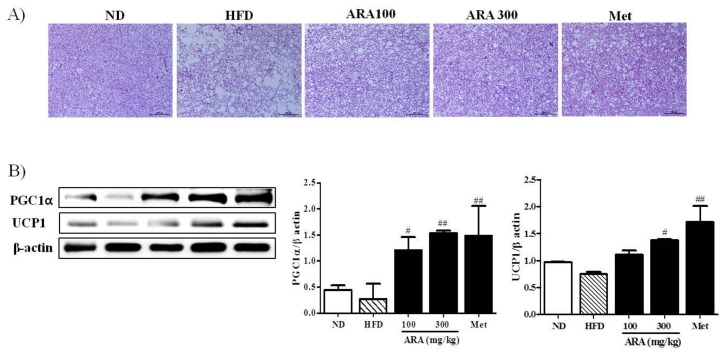
Figure 5.
Effects of ARA on energy metabolism in brown fat. (A) hematoxylin and eosin staining in brown adipose tissues, original magnification 100×, Scale bar: 200 µm; (B) PGC1α and UCP1 protein levels in brown adipose tissues. Results are presented as means ± standard errors of the mean (SEM) (n = 3). ## p < 0.01, # p < 0.05 versus the high fat diet fed mice (the HFD group). UCP1, uncoupling protein.

