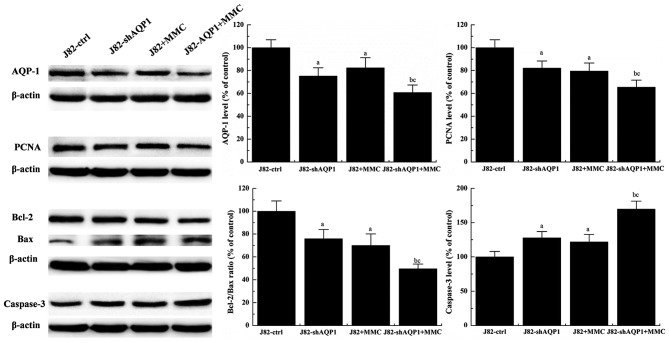
Figure 3.
Western blot analysis of expression of AQP-1, Bax, Bcl-2, caspase-3 and PCNA. Data were presented as mean ± standard deviation. aStatistically significant difference vs. J82-ctrl cells (P<0.05); bStatistically significant differencevs. J82-ctrl cells (P<0.01); cStatistically significant difference vs. J82+MMC group (P<0.05). AQP, aquaporin; ctrl, control; Bcl-2, B cell lymphoma 2; Bax, Bcl-2 associated X protein; PCNA, proliferating cell nuclear antigen; MMC mitomycin C; sh, short hairpin.

