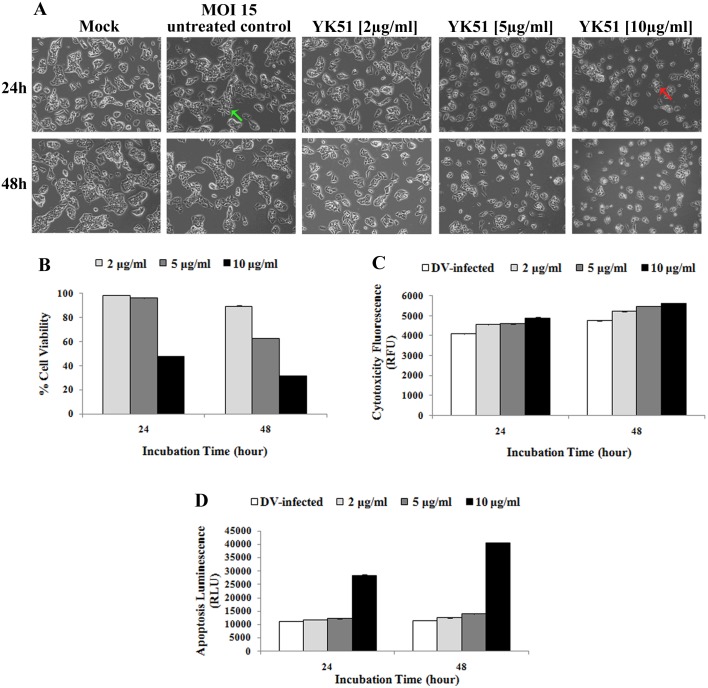
Figure 3. Cell morphology (A), viability (B), cytotoxicity (C) and apoptosis (D) of infected HepG2 cells at different compound concentrations and incubation times.
Cell shrinkage and rounded morphology (red arrow) were observed in HepG2 cells with increasing concentrations of YK51 compound. Reduction of cell populations was also detected during the course of prolonged incubation with the compound. Uninfected and untreated HepG2 cells served as the negative control. Green arrow indicated the normal infected HepG2 cells. All images were captured at 100× magnification. High compound dose and prolonged exposure period significantly decreased the percentage of cell viability to more than 50% and markedly increased the cytotoxicity and caspase-3/7 activities (>2-fold) when compared to the untreated control. Thus, YK51 compound reduced the cell viability while increased the cytotoxicity and apoptosis rates in a dose- and time-dependent manner. The results are presented as the mean ± standard deviation of three independent experiments.

