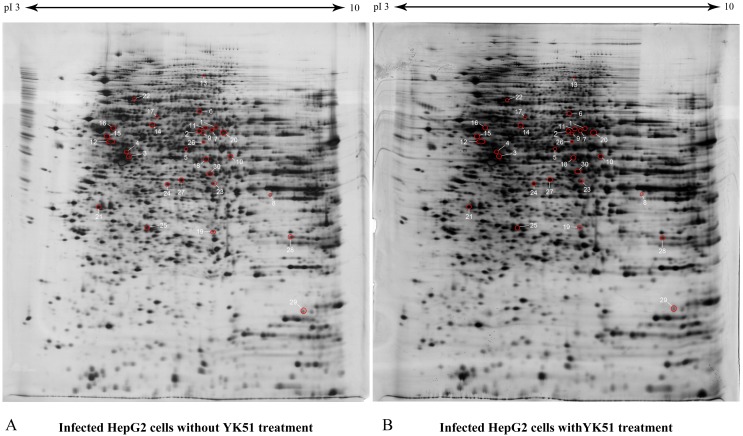
Figure 5. The proteome maps of differentially expressed whole cell proteins in DENV2-infected HepG2 cells with and without YK51 treatment.
HepG2 proteomes (40 µg) were profiled using 13 cm, pH 3 to 10 linear IPG strip and 12.5% SDS gel. There were 30 identified protein spots in the gel map. Red circles denote identified protein spots which changed in abundance compared to proteome of DENV2-infected HepG2 cells without YK51 treatment. The spot numbers correspond to spot numbers in Table 2.

