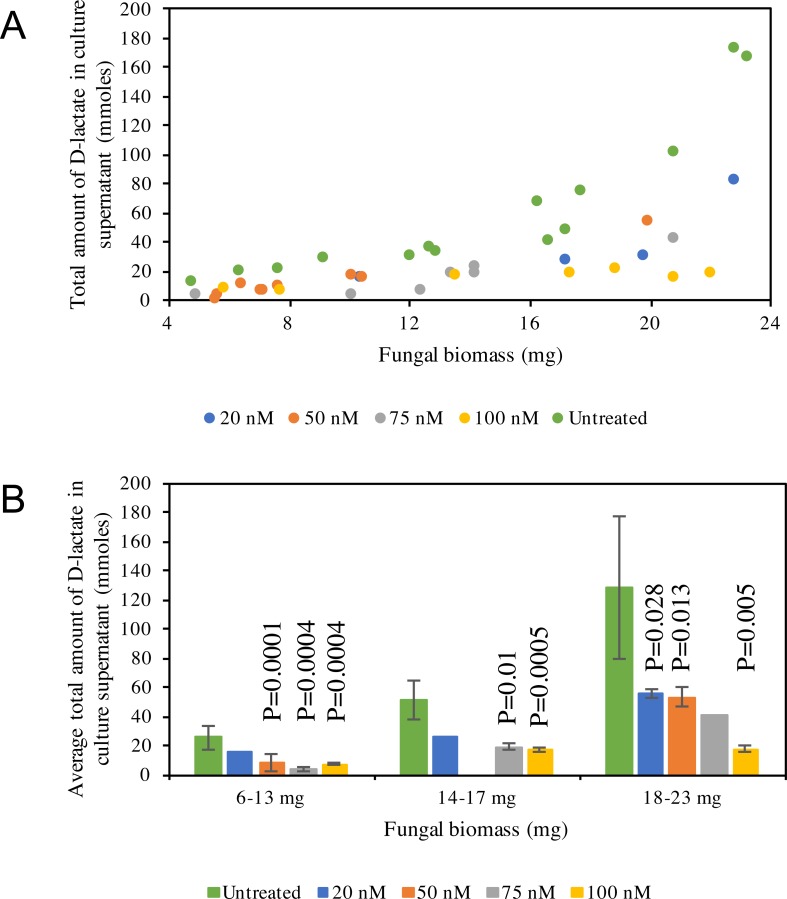
Figure 5. D-lactate in culture supernatant.
(A) Pattern of D-lactate production in C1A culture supernatant as a factor of fungal biomass. The majority of the D-lactate production occurs at the late log-early stationary phase. Data is shown for both siRNA-untreated cultures (green), as well as ldhD-specific siRNA-treated cultures with final concentration 20 nM (dark blue), 50 nM (orange), 75 nM (grey), and 100 nM (yellow). (B) A bar-chart depicting average ± standard deviation (from at least two replicates) of D-lactate levels in C1A culture supernatant during early log (6–13 mg biomass), mid-log (14–17 mg biomass), and late log/early stationary (18–23 mg) phases. Data is shown for both siRNA-untreated cultures (green), as well as ldhD-specific siRNA-treated cultures with final concentration 20 nM (dark blue), 50 nM (orange), 75 nM (grey), and 100 nM (yellow).

