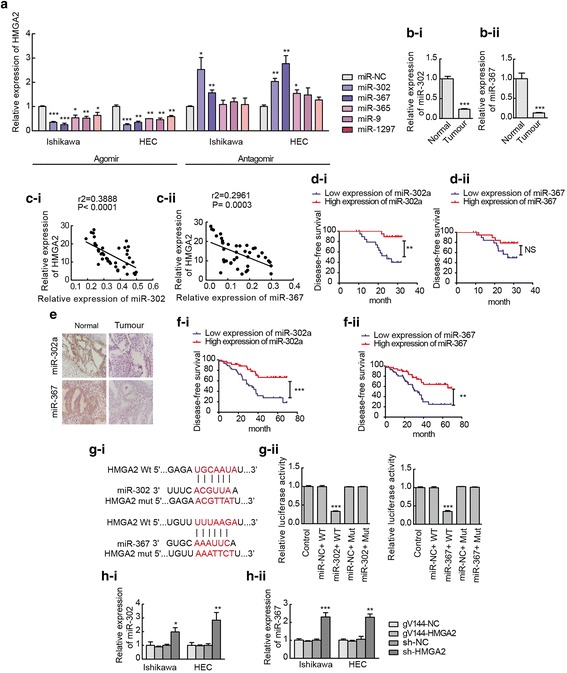
Fig. 3.

HMGA2 is a target of miR-302a-5p and miR-367-3p. a Changes in miRNA expression and the expression of HMGA2 mRNA were detected via qRT-PCR in Ishikawa and HEC-1A cell lines. Data are presented as the mean ± SEM (n = 3 per group). b miR-302a-5p/367-3p was downregulated in endometrial carcinoma tissues (n = 40) compared with normal tissues (n = 37). Data are presented as the mean ± SEM. c A significant correlation between the levels of miR-302a-5p/367-3p and HMGA2 in endometrial carcinoma tissues (n = 40) was demonstrated using Pearson’s correlation coefficient analysis. miR-302a-5p and HMGA2 (r2 = 0.3888, P < 0.0001); miR-367-3p and HMGA2 (r2 = 0.2961, P = 0.0003). d Disease-free survival curves for miR-302a-5p/367-3p in 40 endometrial carcinoma tissues (n = 40). NS, P > 0.05. e and f Expression of miR-302a-5p/367-3p in 80 endometrial carcinoma tissues and disease-free survival curves. g Predicted miR-302a-5p/367-3p binding sites in the 3’-UTR of wild-type (HMGA2-3’-UTR-WT) and mutant (HMGA2-3’UTR-Mut) HMGA2 sequences. Luciferase reporter assay using HEK293T cells co-transfected with HMGA2-WT (or HMGA2-Mut) and the indicated miRNA. Data are presented as the mean ± SEM (n = 3 per group). h Expression of miR-302a-5p/367-3p was detected using qRT-PCR after the expression of HMGA2 was altered in Ishikawa and HEC-1A cell lines. Data are presented as the mean ± SEM. (n = 3 per group). *P < 0.05, ** P < 0.01, ***P < 0.0001 vs. the NC group
