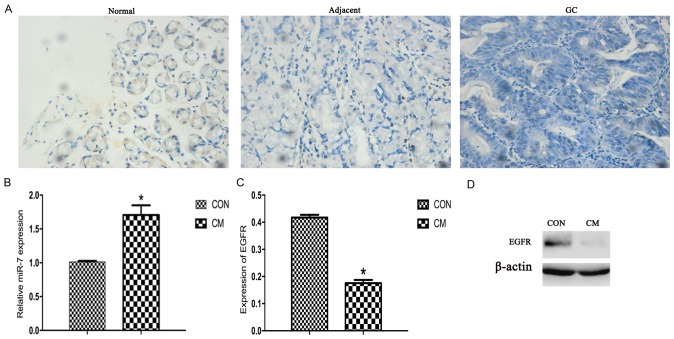
Figure 5.
Expression of miR-7 and EGFR. (A) Hematoxylin staining indicating the expression of miR-7 by in situ hybridization (magnification, ×400). (B) Expression of miR-7 for reverse transcription-quantitative polymerase chain reaction. U6 was used as the internal control. (C) Western blot analysis of EGFR. (D) Representative image of EGFR for western blot analysis. β-actin was used as the internal control. *P<0.05. miR-7, microRNA-7; EGFR, epidermal growth factor receptor; CM, Chinese medicine; Con, control; GC, gastric cancer.

