Figure 1.

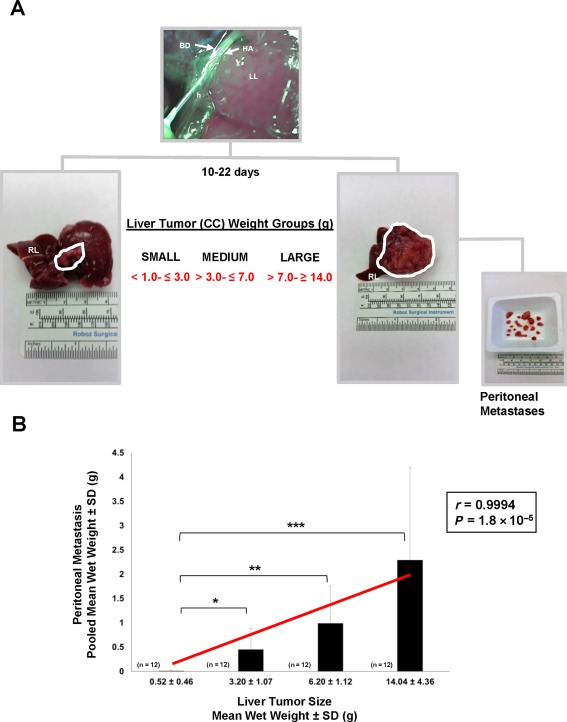
Relationship between liver tumor size and peritoneal metastasis in the rat BDEneu cholangiocarcinoma model. (A) Bile duct inoculation of 5 × 10⁶ rat BDEneu malignant neoplastic cholangiocytes at >90% viability directed through the left hepatic bile duct into the left liver lobe of young adult male syngeneic Fischer 344 rats resulted over a 10‐ to 22‐day period in the formation of distinct mass‐forming liver tumors ranging in size from small to large, with gross peritoneal metastases of various sizes being associated with the larger sized liver tumors. The smaller size liver tumors localized to the left hepatic lobe, whereas the largest sized tumors typically replaced much if not all of the normal left and median liver lobe tissue. The corresponding right liver lobe was typically free of gross tumor in this rat cholangiocarcinoma model. The left hepatic artery and hepatic hilus are labeled to help denote the positioning of the inserted inoculating needle. (B) Bar graph and corresponding linear regression curve, with Pearson's correlation coefficient (r) demonstrating a strong positive correlation between increasing mean liver tumor wet weight and increasing pooled mean gross peritoneal metastases wet weight in the BDEneu rat cholangiocarcinoma model. Wet weight measurements were made on entire amounts of liver tumor tissue and associated peritoneal metastases individually dissected from a total of 48 tumor‐bearing rats; n, number of animals analyzed per liver tumor weight group; each bar value, mean ± SD. *P ≤ 2 × 10⁻³, **P ≤ 2 × 10⁻⁴, ***P ≤ 4 × 10⁻⁴. Abbreviations: BD, bile duct; CC, cholangiocarcinoma; h, hepatic hilus; HA, left hepatic artery; LL, left liver lobe; RL, right liver lobe. Ruler Scale in mm, cm and inches.
