Figure 3.

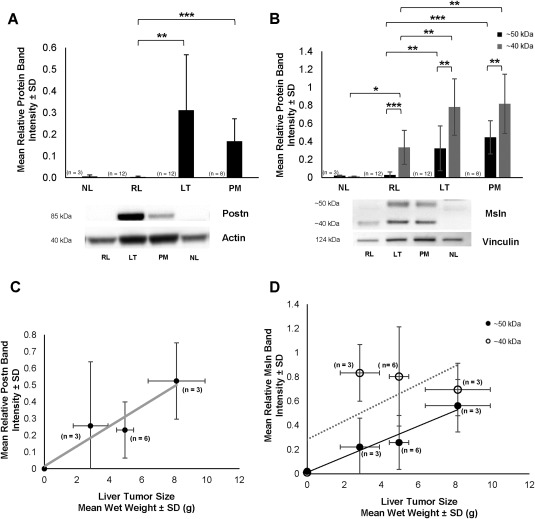
Quantitative western blot analysis of Postn and Msln expression in the rat BDEneu cholangiocarcinoma model. (A) Bar graph demonstrating Postn overexpression in BDEneu liver tumor tissue and associated peritoneal metastases but not in corresponding right liver lobe tissue without cholangiocarcinoma or in liver tissue samples from normal untreated rats. (B) Differential overexpression of 50‐kDa and 40‐kDa forms of Msln in LT and PM, relative to RL and NL. *P ≤ 1 × 10⁻², **P ≤ 3 × 10⁻⁴, ***P ≤ 3 × 10⁻⁵. (C) Linear regression curve relating increases in BDEneu liver tumor size to increasing tumor Postn expression. Correlation coefficient r = 0.954; P = 0.046. (D) Linear regression curves reflecting a strong positive correlation between increasing BDEneu liver tumor size and increasing levels of 50‐kDa Msln measured in the tumor tissue samples (r = 0.977; P = 0.023) versus a lack of correlation with levels of the 40‐kDa Msln form (r = 0.67, P = 0.328). Postn and Msln band intensities were respectively normalized to actin or vinculin. Values in A‐D represent mean ± SD; n, number of animals from which corresponding tissue specimens were individually obtained for western blot analyses. Abbreviations: LT, liver tumor; NL, normal liver; PM, peritoneal metastases; RL, right liver.
