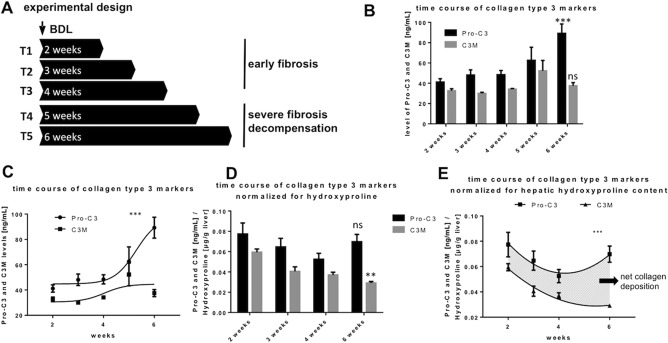
Figure 3.

Levels of Pro‐C3 and C3M with severity of experimental fibrosis in BDL‐rats. (A) Experimental design of the rodent studies with sacrifice at 5 different time points, T1‐3 representing early stages of fibrosis, T4‐5 representing decompensated fibrosis of the liver. (B) Levels of Pro‐C3 and C3M at different time points of sacrifice. Pro‐C3 increased significantly in severe stages of fibrosis. C3M did not change significantly. (C) Significant divergence of levels of Pro‐C3 and C3M with increasing severity of fibrosis. (D) Levels of Pro‐C3 and C3M at different time points of sacrifice normalized for hydroxyproline content per gram of liver tissue. C3M decreased significantly in severe stages of fibrosis. Pro‐C3 did not change significantly. (E) Significant divergence of levels of Pro‐C3 and C3M with increasing severity of fibrosis. The area between the curves represents net collagen type III deposition in the liver (shaded area). *P < 0.05, **P < 0.01, ***P < 0.001; data represent mean ± SEM. Abbreviation: ns, not significant.
