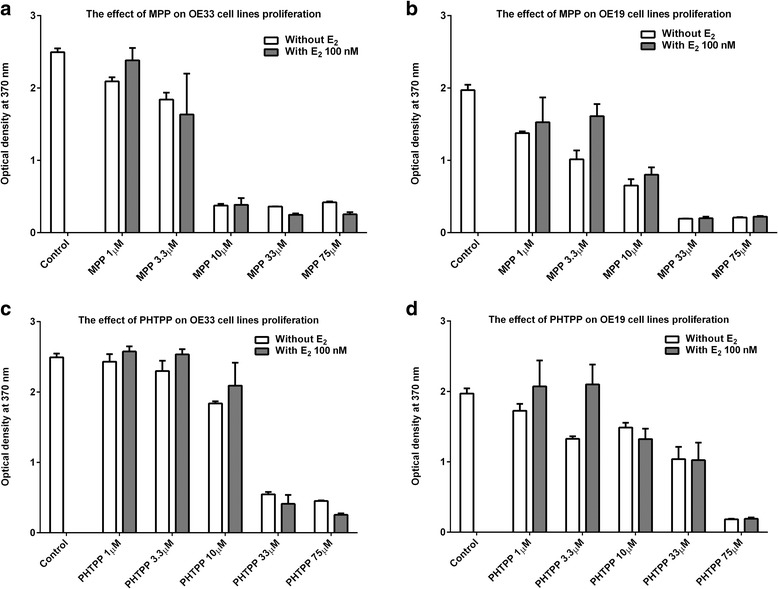
Fig. 3.

MPP and PHTPP affect proliferation of OE33 and OE19 cells. Bar chart demonstrates the effect of increasing dose of MPP and PHTPP on OE33 and OE19 cell line proliferation. Cells were seeded in triplicate using a 96-well plate at a density of 5000 cells/100 μl (without E2). At the 24 h time point, 5 different concentrations of MPP (1 μM, 3.3 μM, 10 μM, 33 μM and 75 μM) or PHTPP (1 μM, 3.3 μM, 10 μM, 33 μM and 75 μM) were added to their corresponding wells. Another set of triplicates of OE33 and OE19 cells were incubated with MPP (1 μM, 3.3 μM, 10 μM, 33 μM and 75 μM) or PHTPP (1 μM, 3.3 μM, 10 μM, 33 μM and 75 μM) grown in similar conditions, with the only exception being that E2 was added (with E2) at the 48 h time point. The proliferation rate for OE33 and OE19 cell lines was evaluated using the BrdU proliferation assay at 72 h time point. a MPP (without E2) showed dose-dependent inhibition of OE33 cell line proliferation (p < 0.0001). Adding E2 after 24 h (MPP + E2) produced no changes in the proliferation rate. b MPP (without E2) showed dose-dependent inhibition of OE19 cell line proliferation (p < 0.0001). Adding E2 after 24 h (MPP + E2) lead to increase of proliferation of OE19 cell line incubated with low concentrations of MPP (1 μM and 3.3 μM) only (p < 0.05). c PHTPP (without E2) showed dose-dependent inhibition of OE33 cell line proliferation (p < 0.0001). Adding E2 after 24 h (PHTPP + E2) produced no changes in the proliferation rate. d PHTPP (without E2) showed dose-dependent inhibition of OE19 cell lines proliferation (p < 0.0001). Adding E2 after 24 h (PHTPP + E2) lead to increase of proliferation of OE19 cell line incubated with low concentrations of PHTPP (1 μM, and 3.3 μM) only (p < 0.05)
