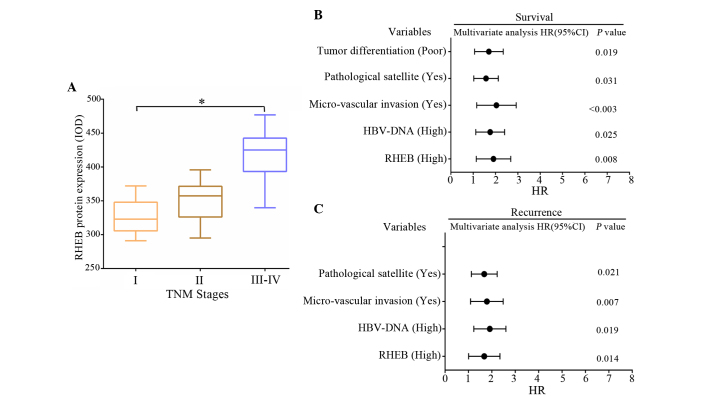
Figure 2.
Correlation analysis between RHEB expression and clinicopathological data of patients with HCC. (A) The differences in RHEB expression between different tumor stages in liver cancer tissues was significant (P=0.020). (B and C) Correlation analysis between different clinicopathological data and (B) survival time and (C) postoperative recurrence of patients with HCC. RHEB, Ras homolog enriched in brain; IOD, integral optical density; HCC, hepatocellular carcinoma; HR, hazard ratio; CI, confidence interval; HBV, hepatitis B virus.

