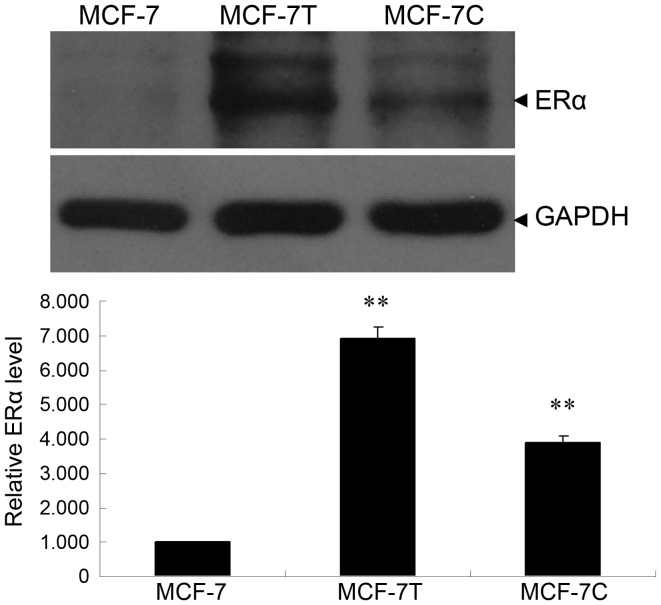
Figure 1.
ERα expression in MCF-7, MCF-7T and MCF-7C cell lines. (A) Western blot analysis and (B) quantitative analysis of western blot analysis normalized to GAPDH. Data presented represent the results of two independent experiments, each performed in duplicate. **P<0.01 compared with MCF-7. ERα, estrogen receptor-α.

