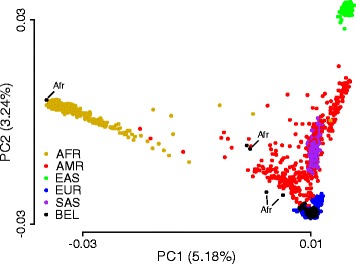
Fig. 3.

Genetic variation of the Belgian population related to continental populations. Plot of the first two principal components (PC) based on a PC analysis using 47,802 SNPs from five continental populations as indicated (AFR African, AMR American, EAS East Asian, EUR European, SAS South Asian). Belgian data (BEL) were mapped independently. Total variability captured by each PC is indicated by axis labels. For Belgian samples with a migration background that map outside the European population, the background is indicated. See main text for SNP filtering criteria
