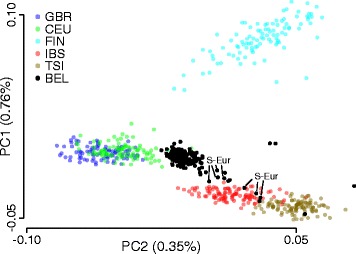
Fig. 4.

Genetic variation of the Belgian population related to other European populations. Plot of the first two principal components (PC) based on a PC analysis using 41,083 SNPs from five other European populations as indicated (GBR British, CEU Utah Residents with Northern and Western European Ancestry, FIN Finnish, IBS Iberian population in Spain, TSI Toscani in Italy). Belgian data (BEL) were mapped independently. Total variability captured by each PC is indicated by the axis labels. All Belgian samples with a South European migration background are indicated. See Additional file 4: Figure S2 for more details related to migration backgrounds. See main text for SNP filtering criteria
