Fig. 5.

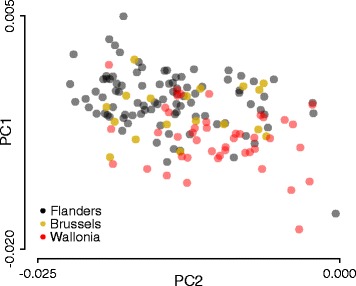
Regional genetic variation within the Belgian population. Belgian samples were mapped on the European PC model (41,083 SNPs) and colored based on the region of inhabitance as indicated

Regional genetic variation within the Belgian population. Belgian samples were mapped on the European PC model (41,083 SNPs) and colored based on the region of inhabitance as indicated