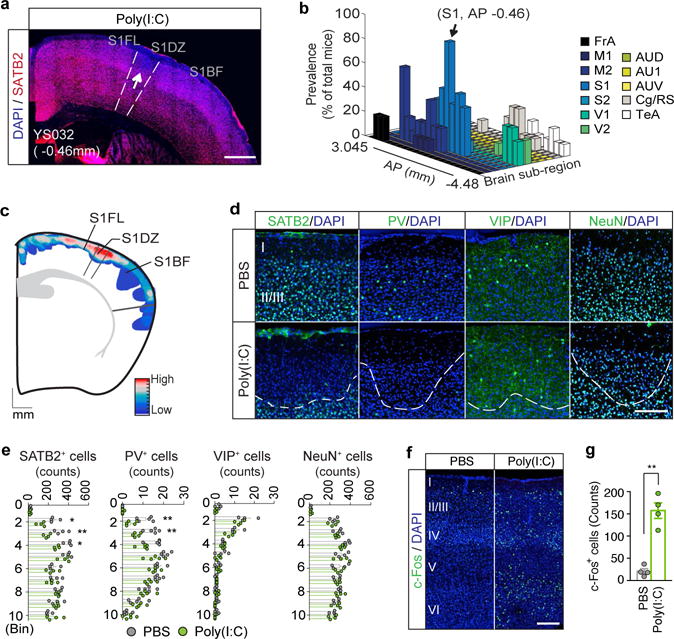
Figure 1. Cortical patches observed in offspring of dams following MIA.

a, Representative S1 image of adult MIA offspring. Arrow indicates cortical patch. Scale bar, 500μm. b, Prevalence of cortical patches (n=10-mice/2-independent experiments) in MIA offspring. c, Superimposed image of cortical patches within AP 0.38–1.34mm (n=50-mice/12-independent experiments). The mouse brain in this figure has been reproduced with permission from Paxinos. Scale indicates frequencies of patches (high=red; low=blue). d, Representative images of S1. White dotted-lines indicate boundary of cortical patches. Scale bar, 100μm. e, Quantification of SATB2+/PV+/VIP+/NeuN+ cells in S1cortical patches (n=4/4-mice (PBS/Poly(I:C)), 3-independent experiments for SATB2/VIP/NeuN; n=5/5-mice (PBS/Poly(I:C)), 3-independent experiments for PV). f, Representative images of c-Fos expression in S1. Scale bar, 100μm. g, Quantification of c-Fos expression in S1 (n=4/4-mice (PBS/Poly(I:C)); 3-independent experiments). *p<0.05,**p<0.01 as calculated by two-way repeated measures ANOVA with Tukey (e) and two tailed unpaired t-test (g). Graphs indicate mean±s.e.m.
