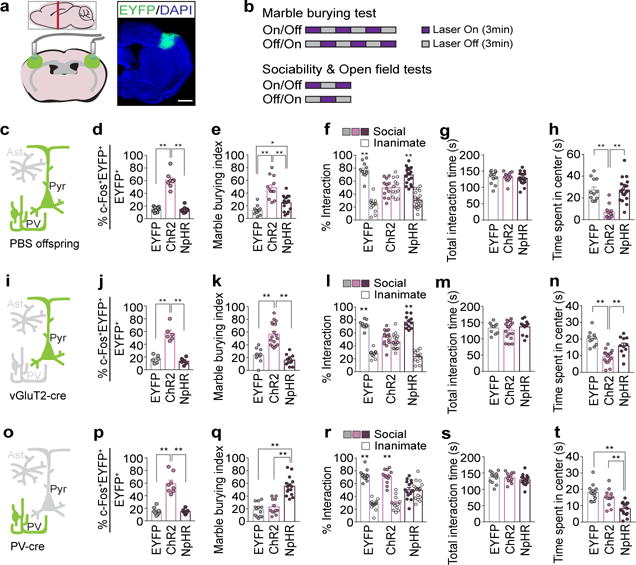
Figure 3. Increasing neural activity in the S1DZ region induces MIA behavioral phenotypes in WT mice.

a, Schematics (left) and representative image (right) of EYFP-expressing virus injection site in the S1DZ-centered cortical region. The mouse brain in this figure has been reproduced with permission from Paxinos. Scale bar, 1mm. b, Optical stimulation protocol. Laser was given in a counterbalanced manner. c,i,o, Schematic of labeled cells (green) in PBS offspring (c), vGluT2-Cre (i), or PV-cre mice (o) (Pyr:Pyramidal neuron, PV:Parvalbumin-positive neuron, Ast:Astrocyte). d,j,p, Percentage of EYFP+ neurons co-expressing c-Fos upon photostimulation (n=8/8/8-mice, 4-independent experiments (PBS offspring;AAV2-hSyn-EYFP/ChR2/NpHR); n=6/6/6-mice, 3-independent experiments (vGluT2-Cre;AAV2-EF1a-DIO-EYFP/ChR2/NpHR); n=8/8/8-mice, 4-independent experiments (PV-cre;AAV2-EF1a-DIO-EYFP/ChR2/NpHR)). e-h,k-n,q-t, Marble burying index (18-min) (e,k,q), % interaction (f,l,r) and total interaction time (g,m,s) during 1st laser-on session of the sociability test, and time spent in center during 1st laser-on session of the open field test (h,n,t) (n=12/12/18-mice, 5-independent experiments (PBS offspring;AAV2-hSyn-EYFP/ChR2/NpHR); n=10/17/11-mice, 5-independent experiments (vGluT2-Cre;AAV2-EF1a-DIO-EYFP/ChR2/NpHR); n=13/12/15-mice, 6-independent experiments (PV-cre;AAV2-EF1a-DIO-EYFP/ChR2/NpHR)). *p<0.05,**p<0.01 as calculated by two-way ANOVA (f,l,r) and one-way ANOVA (d,e,g,h,j,k,m,n,p,q,s,t) with Tukey post-hoc tests. Graphs indicate mean±s.e.m.
