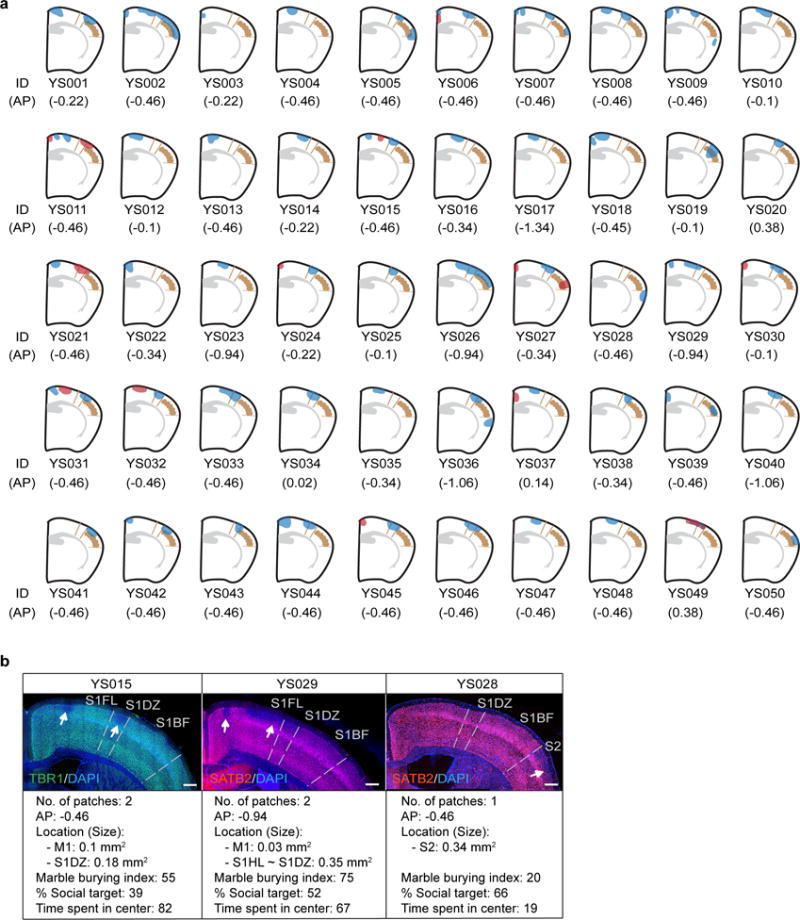
Extended Data Fig. 2. Distribution of cortical patches located within 0.38 ~ −1.34 AP in the brains of MIA offspring.

a, Schematics of the cortical patches located within 0.38~ −1.34 AP in the brains of MIA offspring plotted onto the atlas plane near ~ −0.5 AP. The size of the cortical patches in the schematic is scaled to reflect the actual size as accurately as possible. Blue indicates the cortical patches from one hemisphere and red from the other. The mouse brain in this figure has been reproduced with permission from Paxinos. b, Representative images of the cortical patches in the brains of MIA offspring (a) stained with TBR1 or SATB2 and counterstained with DAPI. The number, locations, and sizes of the cortical patches observed at a given AP level along with each animal’s behavioral performance on the marble burying (marble burying index), sociability (% Social target), and the time spent in the center (s) of an open field are indicated. White arrows indicate cortical patches. Scale bar represents 300μm.
