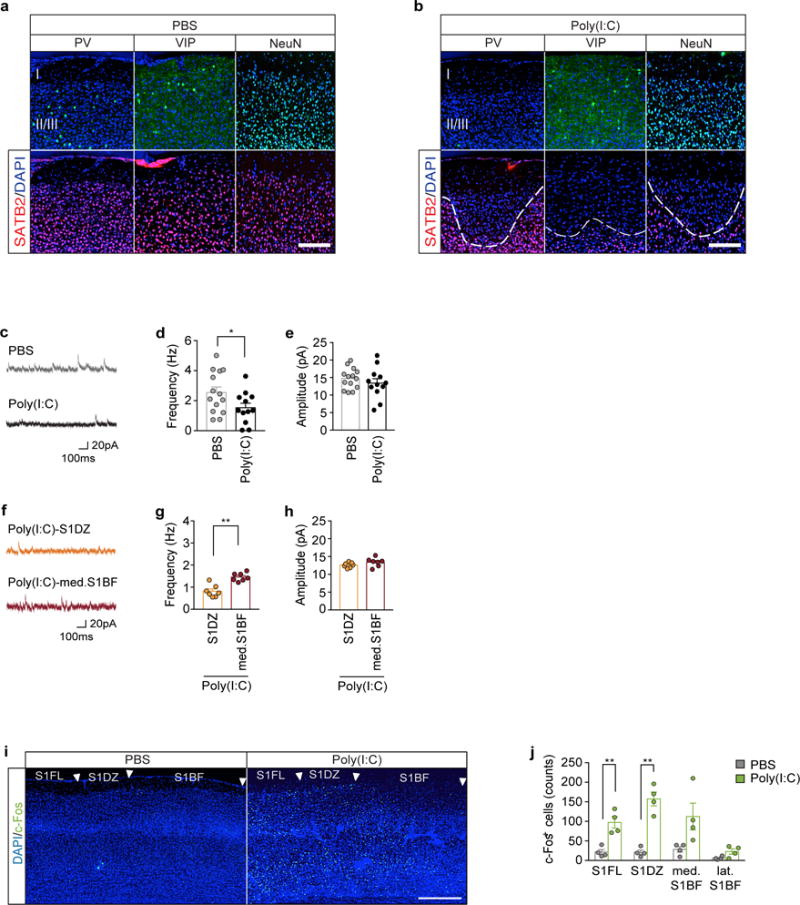
Extended Data Fig. 3. MIA offspring display reduced inhibitory drive onto pyramidal neurons in S1 cortical patches.

a, Images cropped in layer I, II, and III of S1 and stained for SATB2 (red) with PV, VIP, or NeuN (green) in offspring from PBS (a) or Poly(I:C) (b) injected dams. Brain slices are counterstained with DAPI (blue). White dotted lines indicate the boundary of cortical patches in MIA offspring. Scale bar represents 100μm. For images shown in Fig. 1d. c. Representative traces of mIPSCs from pyramidal neurons in S1DZ of PBS or MIA offspring. d–e, Average population data depicting the frequency (d) and amplitude (e) of pharmacologically isolated mIPSCs from S1DZ pyramidal neurons described in (c) (n=14-biological independent samples/6-mice/6-independent experiments and 12-biological independent samples/6-mice/6-independent experiments from PBS and MIA offspring, respectively). f, Representative traces of mIPSCs from pyramidal neuron in S1DZ or med. S1BF of MIA offspring. g–h, Average population data depicting the frequency (g) and amplitude (h) of pharmacologically isolated mIPSCs from S1 pyramidal neurons described in (f) (n=7-biological independent samples/3-mice/3-independent experiments and 7-biological independent samples/3-mice/3-independent experiments for S1DZ and med. S1BF from MIA offspring, respectively). i, Representative image of the S1, stained for DAPI (blue) and c-Fos (green) from adult offspring of PBS- or poly(I:C)-treated mother. Arrows indicate the boundaries of different subregions in the S1. Scale bar represents 300μm. S1FL: Primary somatosensory, forelimb, S1DZ: Primary somatosensory, dysgranular zone, S1BF: Primary somatosensory, barrel field. j, Quantification of c-Fos+ cells throughout the S1 (n=4 PBS and 4 Poly(I:C) mice/4-independent experiments). * p<0.05, **p<0.01 as calculated by two-tailed unpaired t-test (d,e,g,h,j). Graphs indicate mean ± s.e.m.
