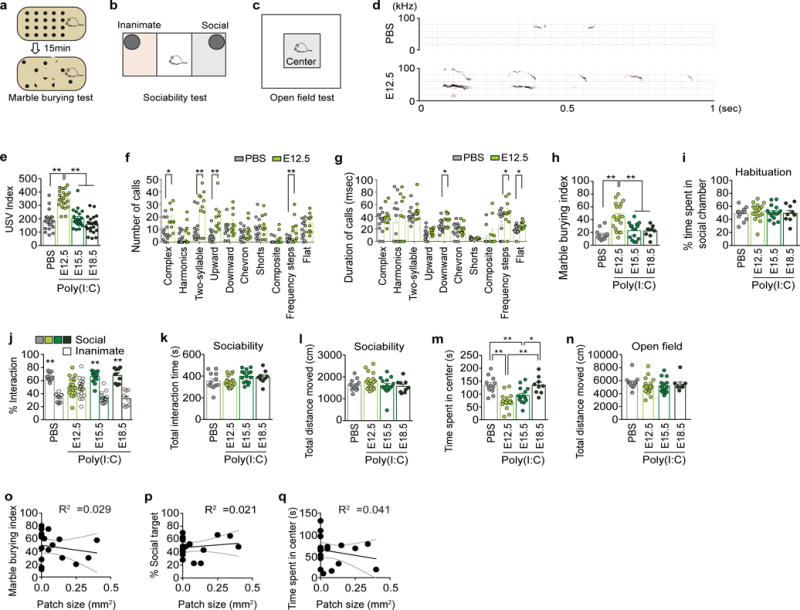
Extended Data Fig. 4. The development of MIA-associated behaviors depends on the time point at which MIA is induced.

a–c, Schematics of the marble burying test (a), sociability test (b), and open field test (c). d. Representative spectrographs of the USVs for PBS and E12.5. e, The ultrasonic vocalization (USV) index represents the number of USVs made by the pups (n=20, 24, 21, and 22 mice for PBS, E12.5, E15.5, or E18.5 groups/5-independent experiments). f–g, The sonograms of USVs emitted by the pups are classified into ten distinct categories and analyzed for the number of calls made and the duration of the calls (msec) within the 1st minute of the recording (n=13 and 10 for pups from PBS- and Poly(I:C)-injected mothers, respectively, at E12.5/3-independent experiments). h–n, The marble burying index (the percentage of marbles buried during the 15-min marble burying test) (h), % time spent in social chamber during habituation period of the sociability test (i), % interaction during the sociability test (the percentage of time spent investigating the social or inanimate stimulus out of the total exploration time of both objects during the 10-min sociability test) (j), the total interaction time (the total exploration time of both objects during the 10-min sociability test) (k), the total distance moved during the sociability test (l), the time spent in the center of an open field (m), and the total distance moved during the open field test (n) of the adult offspring described in (e) (n= 12/19/15/9-mice, 7/7/7/5-independent experiments for PBS/E12.5/E15.5/E18.5 groups). o–q, The size of cortical patches found outside of S1 (within AP 0.38~−1.34mm) in offspring from dams injected with poly(I:C) at E12.5 is plotted against the severity of the featured MIA phenotypes on the marble burying test (o), sociability test as % social target (the percentage of time spent investigating the social stimulus out of the total exploration time of both objects) (p), and open field test (q). Black solid lines represent the regression line and gray dotted lines represent 95% confidence intervals (n=19-mice/7-independent experiments) for E12.5 group. * p<0.05, ** p<0.01 as calculated by two-tailed unpaired t-test (f,g), two-way ANOVA with Tukey post-hoc tests (j), one-way ANOVA with Tukey post-hoc tests (e,h,i,k,l,m,n), and Linear regression (o,p,q). Graphs indicate mean ± s.e.m.
