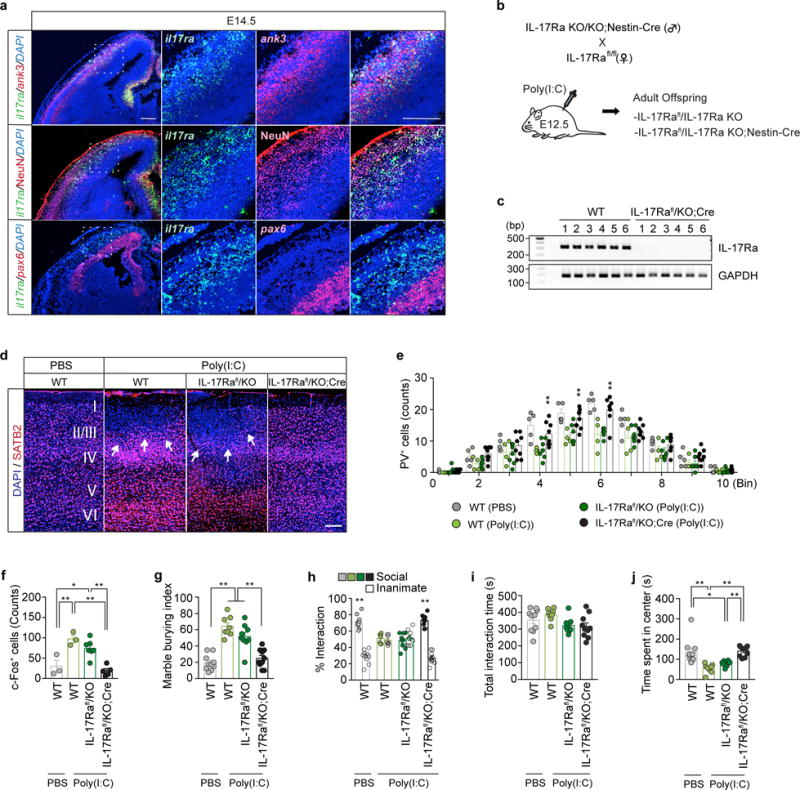
Extended Data Fig. 5. IL-17Ra expression is required in the fetal brain to induce behavioral abnormalities upon MIA.

a, Representative images of the embryonic cortex at E14.5 stained for il17ra (green) and ank3, NeuN or pax6 (red) in offspring from poly(I:C)-injected dams. Brain slices were counterstained with DAPI (blue). Scale bar represents 200μm. (n=3-mice/2-independent experiments) b, Schematic showing the breeding scheme. Homozygous IL-17Ra KO animals carrying Nestin-Cre transgene were crossed to homozygous IL-17Ra conditional line (IL-17Rafl/fl). c, il17ra and gapdh mRNA expression levels in S1 of WT or IL-17Rafl/KO;Cre mice were measured using conventional RT-PCR. Image indicates mRNA expression levels found in individual animals (n=6-mice/2-independent experiments). d, Representative images of SATB2 (red) expression in S1 of offspring with indicated genotypes (WT, IL-17Rafl/KO, or IL-17Rafl/KO;Cre) from mothers injected with PBS or poly(I:C). Scale bar represents 100μm (n=5, 4, 7, and 8 mice from WT (PBS), WT (Poly(I:C)), IL-17Rafl/KO (Poly(I:C)), and IL-17Rafl/KO;Cre (Poly(I:C))/4-independent experiments). e, Quantification of PV positive cells in regions centered on S1 cortical patches around AP-0.46mm, divided into ten equal bins representing different depths of the cortex, of MIA offspring or in corresponding regions of PBS offspring with indicated genotypes (n=5, 4, 7, and 8 mice from WT (PBS), WT (Poly(I:C)), IL-17Rafl/KO (Poly(I:C)), and IL-17Rafl/KO;Cre (Poly(I:C))/4-independent experiments). f, Quantification of c-Fos+ cells in the S1 at around AP-0.46mm (n=3, 3, 7, and 5 mice, from WT (PBS), WT (Poly(I:C)), IL-17Rafl/KO (Poly(I:C)), and IL-17Rafl/KO;Cre (Poly(I:C))/4-independnt experiments). g–j, The marble burying index (g), the % interaction (h) and the total interaction time (i) during the sociability test, and the time spent in the center of an open field (j) of the adult offspring described in (b) (n= 10, 8, 9, and 10 mice for WT (PBS), WT (Poly(I:C)), IL-17Rafl/KO (Poly(I:C)), and IL-17Rafl/KO;Cre (Poly(I:C)) groups/5-independent experiments). * p<0.05, ** p<0.01 as calculated by two-way repeated measures ANOVA with Tukey post-hoc tests for statistical comparison between the WT (Poly(I:C)) and IL-17Rafl/KO;Cre (Poly(I:C)) (e), one-way ANOVA with Tukey post-hoc tests (f,g,i,j), and two-way ANOVA with Tukey post-hoc tests (h). Graphs indicate mean ± s.e.m.
