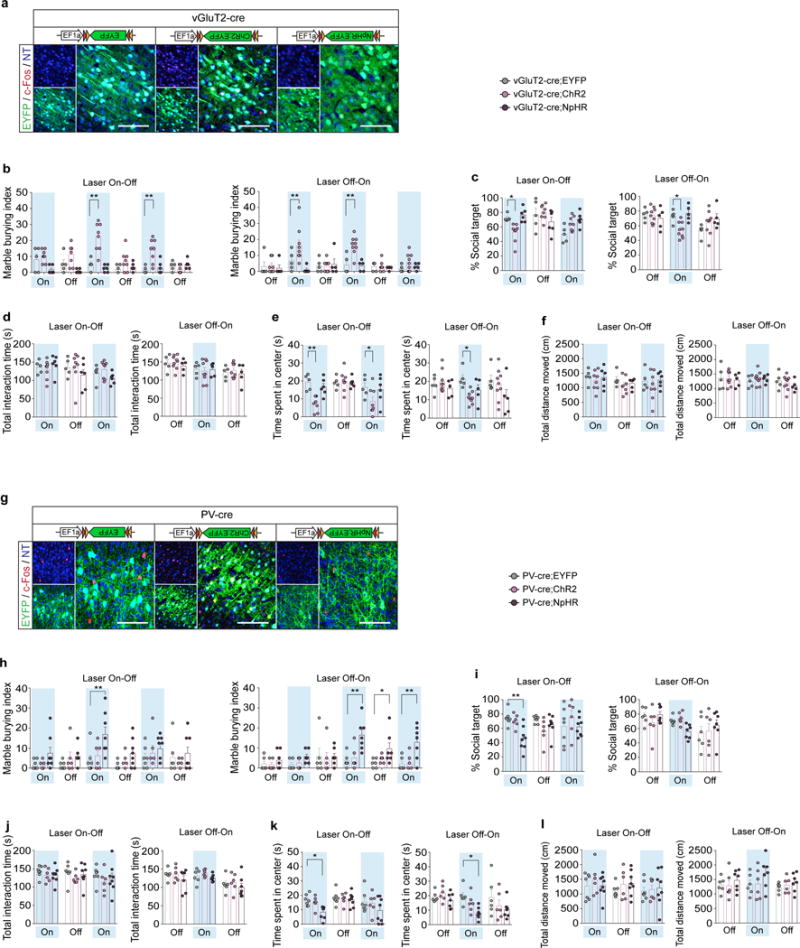
Extended Data Fig. 7. Increasing neural activity in vGluT2-positive neurons or decreasing neural activity in PV-positive neurons of WT animals creates MIA behavioral phenotypes.

a,g, Representative images of c-Fos expression upon photostimulation of the S1DZ in vGluT2-Cre (a) or PV-Cre (g) animals injected with AAV2-EF1α-DIO-EYFP, ChR2-EYFP, or NpHR-EYFP viruses. Coronal sections of the brains were stained for c-Fos (red) and EYFP (green), and counterstained with neurotrace (NT, blue). Scale bar represents 100um. b–l, The marble burying index, the % social target, the total interaction time during the sociability test, the time spent in the center of an open field, and the total distance moved during the open field test with vGluT2-cre (b–f) and PV-cre (h–l) animals are plotted as averages from each individual 3-min sessions. Light blue indicates the laser ‘On’ sessions (‘Laser On-Off’: n=5, 8, and 6 mice, 4-independent experiments; ‘Laser Off-On’: n=5, 9, and 5 mice, 5-independent experiments for vGluT2-Cre animals injected with AAV2-EF1α-DIO-EYFP, ChR2-EYFP, or NpHR-EYFP; ‘Laser On-Off’: n=7, 6, and 8 mice, 6-independent experiments; ‘Laser Off-On’: n=6, 6, and 7 mice, 5-independent experiments for PV-Cre animals injected with AAV2-EF1α-DIO-EYFP, ChR2-EYFP, or NpHR-EYFP). * p<0.05, ** p<0.01 as calculated by two-way repeated measures ANOVA with Tukey post-hoc tests. Graphs indicate mean ± s.e.m.
