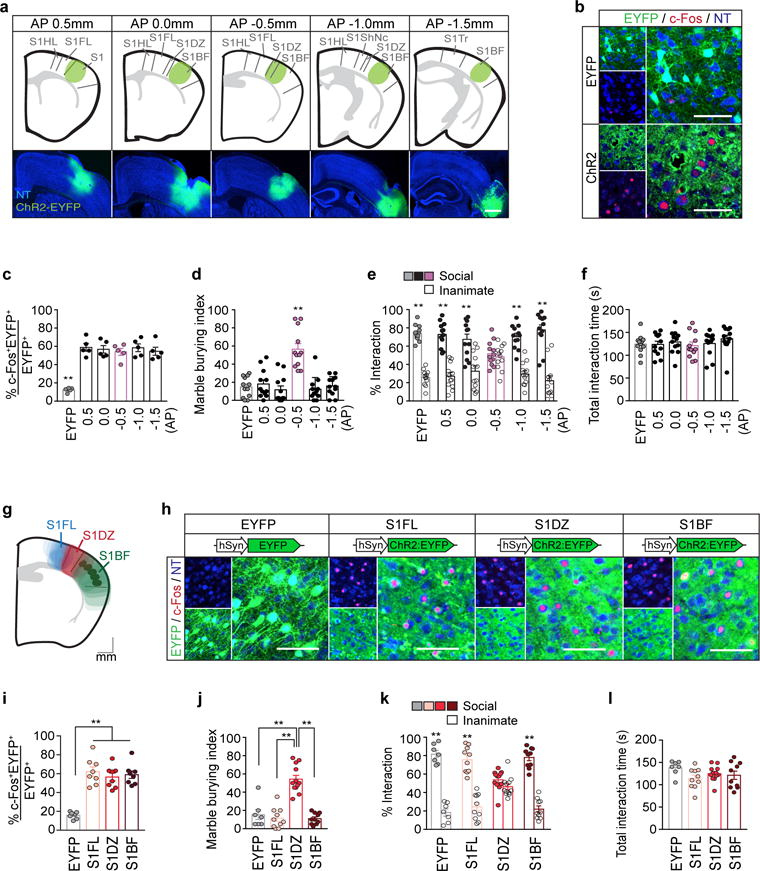
Extended Data Fig. 8. The ability to create MIA behavioral phenotypes by increasing neural activity in WT animals is specific with respect to the AP level and the sub-region of the primary somatosensory cortex.

a, Schematics (top) and representative images (bottom) of the five sites in the S1 of WT animals injected with either AAV2-hSyn-EYFP or AAV2-hSyn-ChR2-EYFP virus (green) (AP= +0.5, +0.0, −0.5, −1.0, or −1.5mm). The mouse brain in this figure has been reproduced with permission from Paxinos. Scale bar represents 300μm. b, Representative images of c-Fos expression upon photostimulation of the injection sites in animals as prepared in (a). Coronal sections of the brains were stained for c-Fos (red) and EYFP (green), and counterstained with neurotrace (NT, blue). Scale bar represents 100μm. c, The percentage of EYFP+ neurons expressing c-Fos upon photostimulation of the injection site (n=5 for WT animals injected with AAV2-hSyn-EYFP at AP=−0.5mm and n=5, 5, 5, 5, and 5 for animals injected with AAV2-hSyn-ChR2-EYFP at AP=0.5, 0.0, −0.5, −1.0, or −1.5mm, 3-independent experiments, respectively). d–f, The marble burying index (d), the % interaction (during the 1st laser-on session) of the sociability test (e), and the total interaction time (during the 1st laser-on session) of the sociability test (f) for animals prepared as in (a) (n=12 for WT animals injected with AAV2-hSyn-EYFP at AP=−0.5mm and n=12, 12, 12, 12, and 12 for those injected with AAV2-hSyn-ChR2-EYFP at AP=0.5, 0.0, −0.5, −1.0, or −1.5mm, 6-independent experiments, respectively). g, A schematic showing the superimposed virus injection sites from individual WT animals, in which AAV2-hSyn-ChR2-EYFP was delivered into the S1FL (blue), S1DZ (red), or S1BF (green). The mouse brain in this figure has been reproduced with permission from Paxinos. h, Representative images of c-Fos expression upon photostimulation of the injection sites shown in (g). Coronal sections of the brains were stained for c-Fos (red) and EYFP (green), and counterstained with neurotrace (NT, blue). Scale bar represents 100μm. i, The percentage of EYFP+ neurons co-expressing c-Fos upon photostimulation of the injection site (n=7 mice for EYFP and 8 mice for S1FL, S1DZ, and S1BF; 3-independent experiments). j–l, The marble burying index (j), the % interaction (during the 1st laser-on session) of the sociability test (k), and the total interaction time (during the 1st laser-on session) of the sociability test (l) for animals prepared as in (g) (n=7 for WT animals injected with AAV2-hSyn-EYFP into S1DZ and n=10, 12, and 10 for WT animals injected with AAV2-hSyn-ChR2-EYFP into S1FL, S1DZ, or S1BF; 3-independent experiments). S1HL: Primary somatosensory, hindlimb, S1FL: Primary somatosensory, forelimb, S1: Primary somatosensory cortex, S1DZ: Primary somatosensory, dysgranular zone, S1BF: Primary somatosensory, barrel field, S1ShNc: Primary somatosensory, shoulder and neck, S1Tr: Primary somatosensory, trunk. * p<0.05, ** p<0.01 as calculated by two-way ANOVA with Tukey post-hoc tests (e,k) and one-way ANOVA with Tukey post-hoc tests (c,d,f,i,j,l). Graphs indicate mean ± s.e.m.
