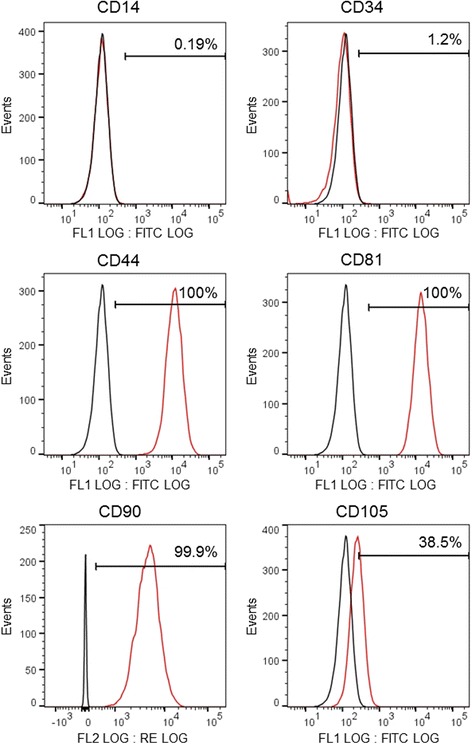
Fig. 1.

Flow cytometric analysis of DPSCs. DPSCs were cultured at P3 or P4, and surface-stained with FITC-conjugated CD14, CD34, CD44, CD81, and CD105 and PE-conjugated CD90. Fluorescent signals were measured by flow cytometric analysis. Black curve represents control cells, red curve represents cells positive for these markers
