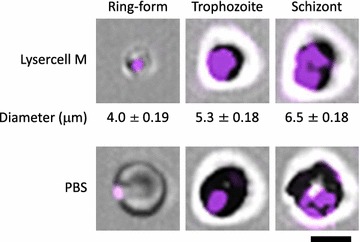
Fig. 1.

Determination of iRBC size after Lysercell M or PBS treatment using ImageStreamX. Representative images of ring-forms, trophozoites, and schizonts are shown. The iRBCs of K1 strain were treated with the Lysercell M (upper panels) or PBS (lower panels). Parasite nuclei were stained by Fluorocell M (purple). iRBC sizes are expressed as mean ± SD from three independent cells. Scale bar denotes 5 μm
