Fig. 2.

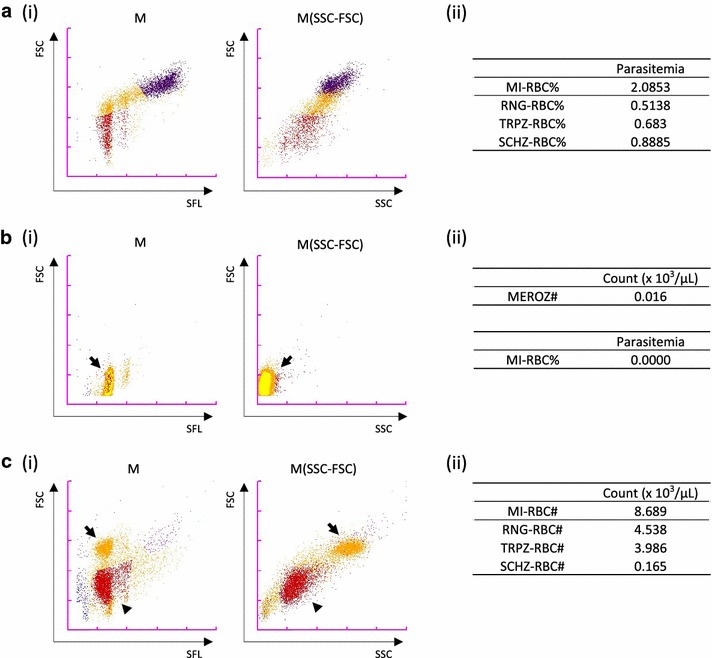
Representative data from the XN-30 analyzer. a Detection of ring-forms, trophozoites, and schizonts of the 3D7 strain. (i) Typical M and M(SSC-FSC) scattergrams. (ii) Parasitaemias of total and each developmental stages. Original data reported from the XN-30 analyzer are provided in Additional file 2: Table S1. b Detection of merozoites of K1 strain. (i) Typical M and M(SSC-FSC) scattergrams. Arrows indicate merozoites. (ii) Count of merozoites (upper panel) and parasitaemia of total iRBCs (lower panel). Original data reported from the XN-30 analyzer are provided in Additional file 2: Table S2. c Detection of gametocytes of 3D7 strain. (i) Typical M and M(SSC-FSC) scattergrams. Arrows and arrowheads indicate mature gametocytes and iRBCs that did not develop to gametocytes and early gametocytes, respectively. (ii) Counts of total and each developmental stages. Original data reported from the XN-30 analyzer are provided in Additional file 2: Table S4. Red, ring-forms; orange, trophozoites; purple, schizonts; yellow, merozoites; and blue, polychromatic RBCs. These experiments were performed in at least triplicate, and representative data are shown
