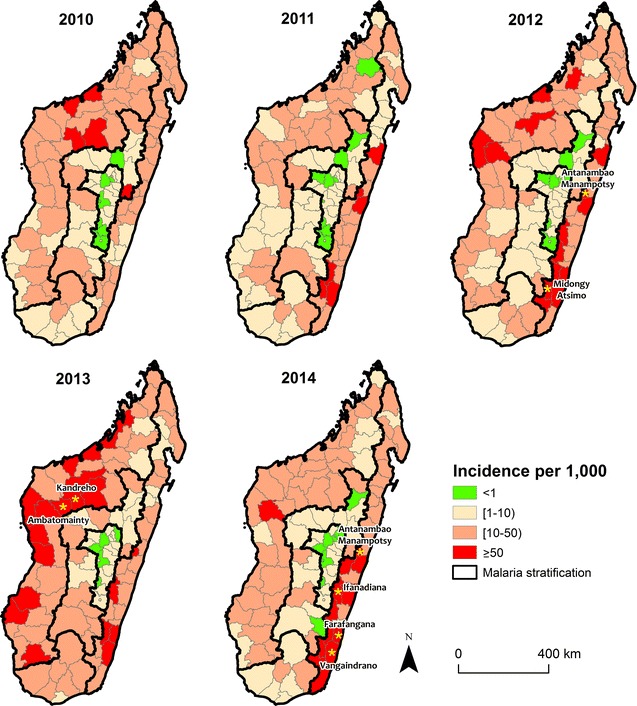
Fig. 2.

The annual incidence per 1000 of malaria from 2010 to 2014 per district. Malaria incidence was classified into four groups according to the malaria elimination phase: pre-elimination—green, moderate and high transmission—shades of red. There is substantial heterogeneity in incidence per strata (outlined in black) regarding crude incidences over the years. Yellow stars represent district with incidence above 100 per 1000. Consistently, the lowest incidence of malaria was found in the Fringe and the Highlands. Most of district colored in red are in the coastal zone (East and West)
