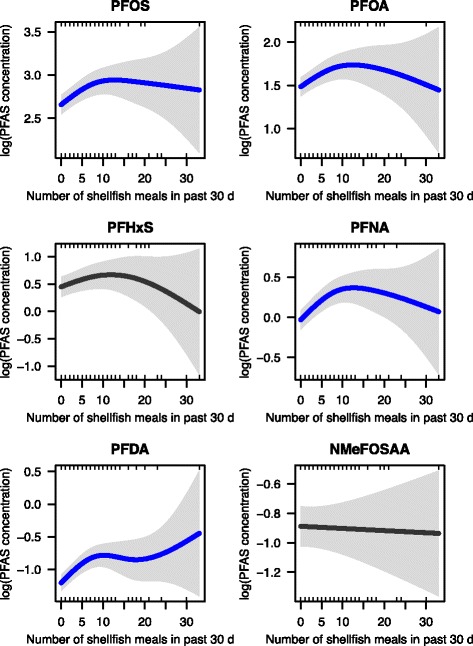
Fig. 5.

Associations between number of shellfish meals consumed in the past 30 days and serum PFAS levels in NHANES 2005–06 participants. The generalized additive model plots are controlled for age, sex, race/ethnicity, household income, body mass index (BMI), born place, prior pregnancy and breastfeeding, menstrual status, military service, tap water sources, and floor type. The solid line is the estimate and statistical significance is shown by color (blue: p < 0.05). Shaded grey areas represent the 95% confidence interval
