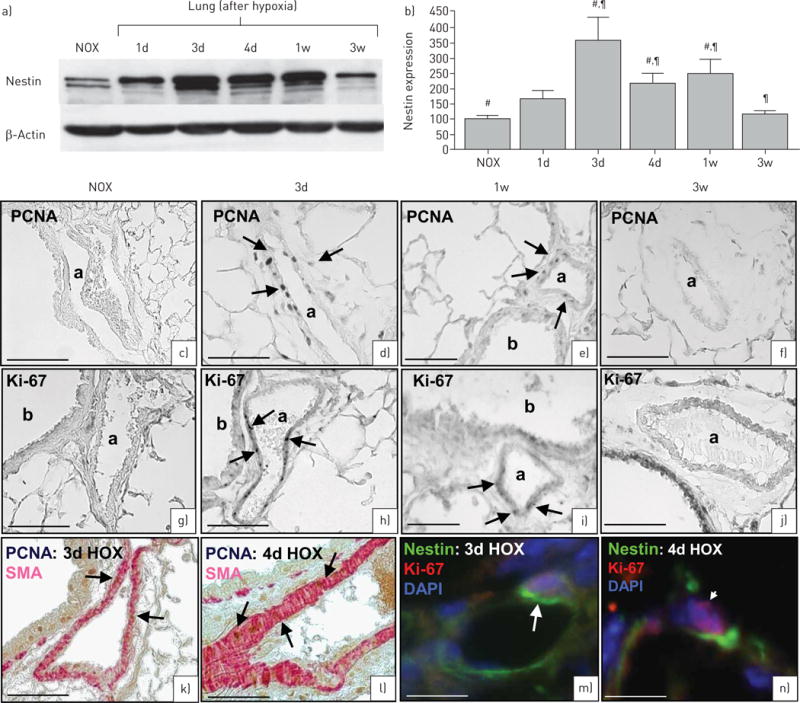
FIGURE 3.

Hypoxic mouse model. Nestin expression and cell proliferation in wild-type mice after hypoxia (HOX). a) Immunoblots demonstrate increased nestin expression after hypoxia; the maximum of nestin expression is between 3 days and 1 week after hypoxia followed by decrease in expression after 3 weeks (120 μg cytosolic protein). b) Densitometric quantification of nestin. Bars show mean±SEM scores from three assessments with β-actin as loading control. #,¶p<0.01 (#: normoxia (NOX) was compared with 3 days, 4 days and 1 week;¶: 3 weeks was compared with 3 days, 4 days and 1 week). c–f) Proliferating cell nuclear antigen (PCNA) immunostaining. c) Normoxia: no PCNA-marked cells. d, e) 3 days hypoxia (d) and 1 week hypoxia (e): numerous PCNA-marked vascular smooth muscle cell (VSMCs). f) 3 weeks hypoxia: no PCNA-marked cells. g–j) Ki-67 immunostaining. g) Normoxia: no Ki-67-marked cells. h, i) 3 days hypoxia (h) and 1 week hypoxia (i): numerous Ki-67-marked VSMCs. j) 3 weeks hypoxia: no Ki-67-marked cells. k, l) 3 days (k) and 4 days (l) hypoxia: PCNA (brown) is localised to smooth muscle actin (SMA)+ VSMCs (red). m, n) 3 days (m) and 4 days (n) hypoxia: the proliferation marker Ki-67 (red, arrowhead) is co-localised with nestin (green, arrow) in the same cell. Nuclei are stained with 4′,6-diamidino-2-phenyl-indole (DAPI) (blue). 1d: 1 day; 3d: 3 days; 4d: 4 days; 1w: 1 week; 3w: 3 weeks. Scale bars: a, g, k–n) 75 μm; d–f, h–j) 75 μm.
