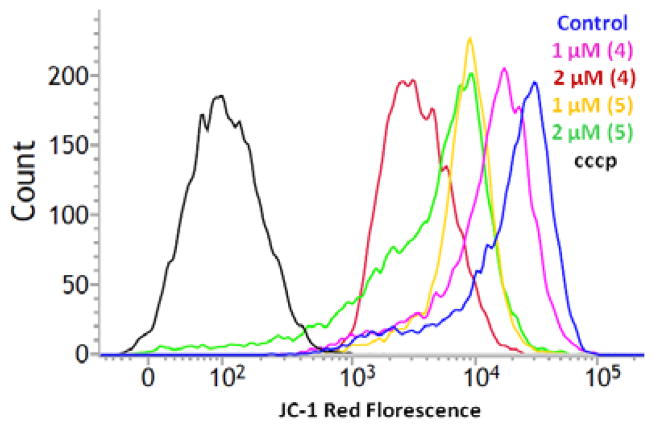
Figure 10.
Effects of complex 4 and 5 on the mitochondrial membrane potential in T98G glioma cells. Plot shows JC-1 reagent red fluorescence intensity curve of cells after treatment with complexes. The horizontal axis shows the red fluorescence intensity (PE-A), and the vertical axis indicates the cell count. The dark blue curve indicates the untreated negative control and black curve indicates positive control cell population is treated by proton ionophore carbonyl cyanide 3-chlorophenylhydrazone (cccp). A curve shift from the negative control curve to the cccp treated curve indicates a loss of mitochondrial membrane potential.

