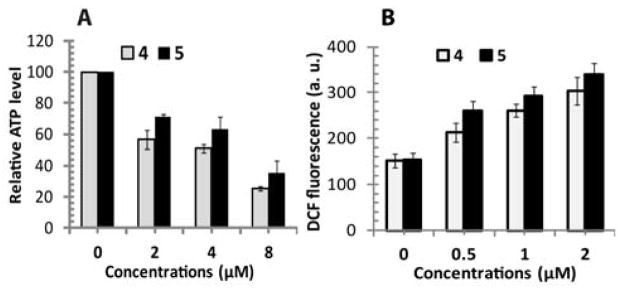
Figure 8.
Intracellular ATP and reactive oxygen species (ROS) detection. (A) The relative intracellular ATP value of T98G cells in DMEM media. T98G cells exposed to 4 and 5 showed much decreased ATP level and metabolic activity at 24 h following treatment. (B) ROS generation in T98G cells treated with complexes 4 and 5. Data are displayed as the mean fluorescence intensity of DCF using a H2DCFDA probe.

