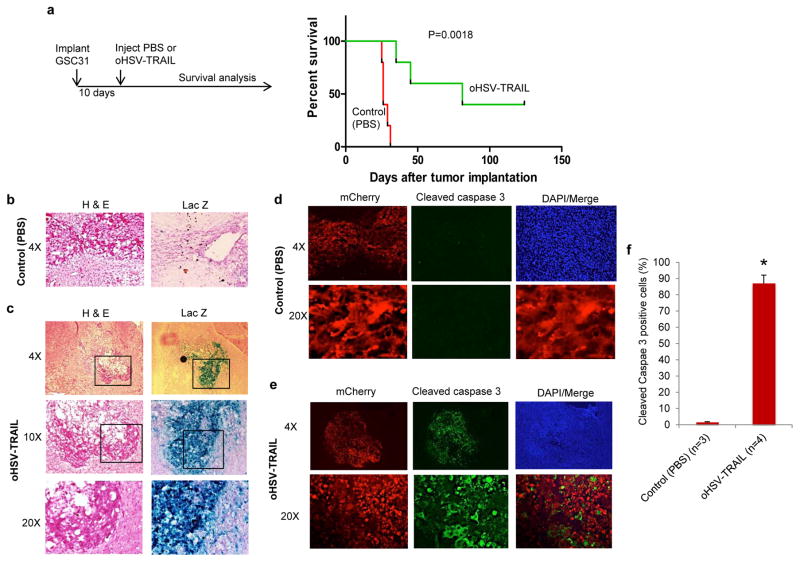
Figure 5. oHSV-TRAIL mediated robust apoptosis and markedly prolonged survival of mice bearing orthotopic tumors generated with recurrent GSC31.
a, Experimental schema and Kaplan-Meier survival curves of GSC31 tumor-bearing mice treated with oHSV-TRAIL or control (PBS). P = 0.0018, log-rank test. b, c, H & E staining (left panels) and X-gal staining (right panels) of tumor sections from control (PBS)-injected (b) and oHSV-TRAIL (c)-injected tumors. Infected cells stain blue with X-gal. Original magnification is indicated. In c, boxed areas are magnified in the lower panels. d, e, Lower (4×, upper) and higher (20×, lower) magnification confocal microscopic images of cleaved caspase 3 immunofluorescence (green) on brain sections from control (PBS) (d) or oHSV-TRAIL (e)-injected mice. mCherry-positive tumor cells and DAPI (nuclei) of the same slides and the merged images of mCherry and cleaved caspase 3 are also shown. f, Plot showing the percentage of cleaved caspase 3 positive tumor cells on brain sections. *P = 0.0015. Error bars indicate SD.

