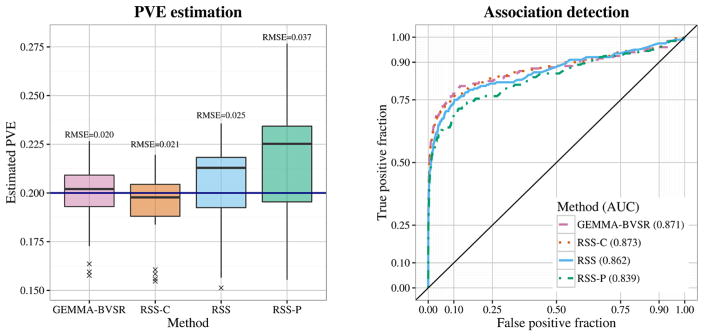
Fig. 1.
Comparison of PVE estimation and association detection on three types of LD matrix: cohort sample LD (RSS-C), shrinkage panel sample LD (RSS) and panel sample LD (RSS-P). Performance of estimating PVE is measured by the root of the mean square error (RMSE), where a lower value indicates better performance. Performance of detecting associations is measured by the area under the curve (AUC), where a higher value indicates better performance.

